Introduction
Walmart's data-driven last-mile optimization works by feeding historical delivery, GPS, traffic, address, and order data into routing and dispatch systems so that stop sequencing, scheduling, and delivery windows are set on real conditions instead of static assumptions — the same data-first approach any high-volume retailer needs given how thin last-mile margins run. According to Capgemini's research, last-mile delivery accounts for 41% of total supply-chain costs — despite being the shortest segment of the entire logistics chain. Retailers spend an average of $10.10 per last-mile order while recovering only $8.08 from customers, a structural margin problem that compounds with every additional parcel.
Most last-mile failures aren't operational accidents — they're data blind spots. Companies lack the right data, at the right time, to make sound decisions on routing, scheduling, and dispatch.
The result: failed deliveries, frustrated customers, and bloated cost-per-order figures that push margins lower with every failed stop.
This article covers:
- Which data sources actually drive last-mile optimization
- How that data solves the five most persistent delivery challenges
- What workflow and metrics to put in place to measure progress
Key Takeaways
- Last-mile costs represent 41% of total supply-chain costs — and most of that waste is recoverable with better data
- Failed first-attempt deliveries cost carriers an estimated $17–$18 per redelivery — preventable with address validation and proactive customer notifications
- Route optimization, real-time GPS, and constraint-based scheduling each address distinct cost drivers
- Three KPIs matter most: on-time delivery rate, first-attempt success rate, and cost per delivery
- Platforms supporting 50+ optimization constraints enable realistic scheduling, not optimistic guesswork
The Real Cost of Running Last-Mile Operations Without Data
The Financial Impact of Failed Deliveries
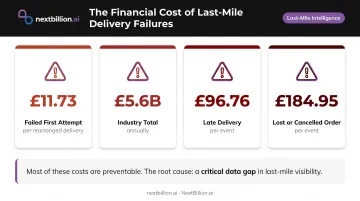
Every failed delivery is an avoidable expense. A UK industry study by IMRG found that pre-pandemic first-attempt failure rates ran at approximately 4.26–4.3%, with each rearranged failed delivery costing carriers £11.73. Scale that across thousands of daily stops and the numbers compound quickly.
Broader failure categories carry steeper penalties. A late delivery costs £96.76 per event. A lost or cancelled order: £184.95. Across the UK home-delivery industry alone, delivery failures add up to over £5.6 billion annually — not from operational inevitability, but from preventable data gaps. The underlying causes translate directly to any high-volume delivery operation, including US retail networks operating under the same DOT-regulated driver hours and delivery-window pressures.
The Hidden Cost of Manual Routing
Manual or intuition-based routing compounds these losses in ways that don't show up cleanly on a P&L:
- Drivers take longer paths because stop sequencing wasn't optimized
- Delivery time windows get missed because route planners couldn't account for real-time traffic
- Vehicle capacity goes underutilized because order batching was done by hand
- Fuel and labor costs accumulate on every suboptimal route, every day
None of these show up as a single line item. They accumulate silently across hundreds of routes.
The Customer Experience Gap
Without data, companies can't offer live ETAs or proactive delay notifications. That gap has measurable consequences: IMRG found that 95% of customers want delivery confirmation, and roughly 25% of late deliveries generate a WISMO (Where Is My Order) inquiry. Each of those contacts costs money to handle.
Those support costs are just the opening number. Capgemini found that 48% of consumers dissatisfied with delivery intend to stop purchasing from that retailer — while satisfied customers plan to increase spend by 12%. A single bad delivery experience doesn't just create a ticket; it ends a customer relationship.
None of this is inevitable. The gap between a costly delivery operation and an efficient one is largely a data gap — and the rest of this guide covers exactly what closing it looks like in practice.
The Data Sources That Power Last-Mile Optimization
Five data streams, properly connected, form the operational backbone of any effective last-mile system.
Historical Delivery Data
Past performance is the training ground for accurate future planning. Historical data on average stop times by zone, traffic delays by hour, seasonal volume patterns, and dwell time by customer type lets route planning systems build realistic schedules — not ones that assume everything goes perfectly. ETAs improve when the system has already learned that a particular apartment complex consistently adds 4 minutes per stop.
Real-Time GPS and Telematics Data
Live vehicle location, speed, idling, and route deviation data allow dispatchers to replan dynamically rather than reacting after the fact. NextBillion.ai's Live Tracking API provides tracking accuracy up to 1 meter, with offline tracking capability for low-connectivity areas, and supports integration with fleet management platforms like Samsara and Geotab — creating two-way data flow between tracking, routing, and existing telematics systems.
Traffic and Road Condition Data
A driver hitting a road closure they could have avoided is a failure of the routing system, not the driver. Road closures, construction zones, accident feeds, and real-time congestion data all need to be inputs at route generation time — not discoveries made in the field. NextBillion.ai's Route Optimization API incorporates real-time traffic via traffic_timestamp and departure_time parameters, recalculating routes based on current conditions rather than static maps.
Customer and Delivery Address Data
Geocoding accuracy and address validation directly determine whether a driver can physically complete a delivery. The data that matters most here includes:
- Delivery time windows — customer-specified or contractually required
- Access instructions — gate codes, parking constraints, loading dock availability
- Precise entry points — apartment complex ingress routes, building access paths
Custom mapping that encodes these details can eliminate entire categories of "address not found" failures before a single route is dispatched.
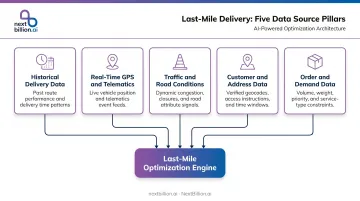
Order and Demand Data
Upstream order data enables intelligent stop batching, proper vehicle-to-load matching, and stop sequencing for minimum drive time. When the dispatch system knows what's being delivered, where, and when before routes are built, it can optimize across all those variables simultaneously rather than treating each stop as an isolated problem.
How Data Solves the Five Biggest Last-Mile Challenges
Beating Delivery Time Windows
Time-window VRP (Vehicle Routing Problem with Time Windows) is the technical core of this problem. The routing engine ingests each stop's required delivery window alongside vehicle availability, driver shift hours, and service times — then sequences stops to satisfy as many windows as possible without backtracking.
In practice, rigid hard constraints don't always produce feasible routes. NextBillion.ai's Route Optimization API supports 50+ hard and soft constraints, including a maximum_visit_lateness parameter that accommodates minor deviations from time windows when strict adherence would cause downstream failures. This lets planners build routes that are realistic rather than theoretically perfect — a meaningful distinction at scale.
The platform processes up to 10,000 stops in a single optimization request, which means high-volume operations don't need to break routes into smaller batches and sacrifice cross-route efficiency.
Reducing Fuel and Labor Costs
Route optimization cuts total driven distance by solving for the most efficient multi-stop sequence across an entire fleet simultaneously — not just for individual drivers. Algorithmic routing deployments typically produce 10–20% reductions in total miles and fuel, though actual results vary by network density and route complexity. This is the core lever behind how to optimize last mile delivery at scale: fewer miles per stop, tighter batching, and less idle time compound into lower cost per order across the whole network, not just on individual routes.
Dynamic re-routing extends these savings mid-route. When a stop is canceled or a delay occurs, NextBillion.ai's platform handles reoptimization automatically:
- Inserts new orders or removes canceled stops without manual dispatcher input
- Reassigns affected stops in real time rather than waiting for the next planning cycle
- Preserves the rest of the route with minimal disruption
Eliminating Failed First-Attempt Deliveries
Two interventions move the needle most on first-attempt success:
- Address and access data quality — Custom mapping that captures apartment entry points, parking locations, and correct building sides eliminates a significant source of "couldn't find the address" failures
- Customer notification workflows — Automated alerts as drivers approach a delivery zone give recipients time to prepare, reducing no-shows
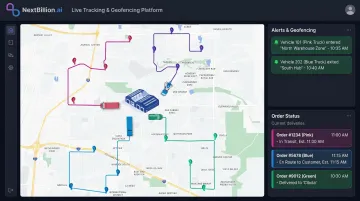
NextBillion.ai's Geofencing API enables automated customer alerts as drivers approach pickup or delivery locations. The Live Tracking API supports real-time order status sharing, giving customers accurate arrival windows rather than static date estimates. Each completed delivery also feeds address-level outcome data back into the system — tightening arrival window accuracy for repeat stops over time.
Scaling During Demand Spikes
Peak seasons expose a consistent gap: operations built around reactive planning can't absorb sudden volume surges. IMRG documented 43% home-delivery volume growth during April/May 2020 — an extreme case, but the underlying pressure repeats every holiday cycle.
The answer is pre-positioning rather than reacting. Historical order data enables logistics managers to:
- Pre-build routes for high-volume zones before orders fully materialize
- Allocate vehicle capacity across the fleet before peak drivers hit
- Set realistic delivery windows during high-demand periods rather than overpromising
NextBillion.ai's platform handles matrix sizes up to 5,000×5,000 stops with processing in approximately 5 seconds, giving operations teams the speed to run bulk planning scenarios ahead of peaks rather than during them.
Improving Driver and Fleet Utilization
Driver behavior data — speeding, excessive idling, route deviations — gives fleet managers the visibility to address issues before they become cost liabilities. NextBillion.ai's Live Tracking API surfaces these signals in real time:
- Alerts for speeding, idling, and boundary violations as they occur
- Post-trip analysis covering toll payments, rest stops, and total time in transit
- Utilization reporting across the full fleet, not just individual vehicles
The utilization upside is concrete. One health-tech logistics customer using NextBillion.ai's platform achieved 35% more visits per rider after optimization, alongside a 25% reduction in travel costs — proof that better utilization adds capacity without adding vehicles.
Building a Data-Driven Last-Mile Workflow
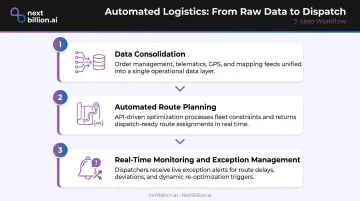
Step 1 — Data Consolidation
Siloed systems are the first obstacle. Order management data sitting in one platform, telematics in another, and route history in a spreadsheet means no single view of operations exists. The starting point is connecting these streams into a unified operational layer:
- Order lists and delivery manifests
- Vehicle parameters and capacity constraints
- GPS and telematics feeds
- Mapping and road-network data
NextBillion.ai integrates with Samsara, Geotab, SAP, Salesforce, and Microsoft Dynamics 365, enabling bidirectional data flow so routing and tracking data flows back into existing ERP and CRM systems.
Step 2 — Automated Route Planning
The shift from manual to API-driven route planning removes hours of daily planning work and produces better routes. The Route Planner App accepts inputs via direct telematics integration or CSV/Excel upload, processes 50+ configurable constraints, and returns optimized, dispatch-ready routes in seconds.
For on-demand or high-volume operations, low-latency response times are critical. NextBillion.ai's Driver Assignment API delivers matching in under one second, keeping operations responsive when orders arrive continuously rather than in batches.
Step 3 — Real-Time Monitoring and Exception Management
The goal isn't for dispatchers to watch every stop. It's to configure the system so dispatchers only intervene on exceptions: flagged delays, route deviations, failed deliveries, or time-window risk. NextBillion.ai supports geofence-based and speed-based alerts that surface exceptions automatically, allowing one dispatcher to manage a significantly larger fleet.
Metrics That Matter: Tracking Last-Mile Performance
| Metric | What It Measures | How to Use It |
|---|---|---|
| On-time delivery rate | % of stops completed within the promised window | Baseline before optimization; track weekly after |
| First-attempt success rate | % of deliveries completed on first attempt | Industry top performers typically hold 95%+; track monthly to catch address-quality issues early |
| Cost per delivery | Total spend ÷ completed deliveries | Break into fuel, labor, and redelivery components |
| Delivery CSAT/NPS | Customer satisfaction tied specifically to delivery | Separate from overall brand NPS for clean signal |
Cost per delivery is the most actionable of these — but only when decomposed. If fuel spend drops but redelivery costs hold steady, address validation is the constraint, not routing. If labor cost per stop is high but fuel is fine, capacity utilization or stop sequencing is the issue. Each cost component points to a different lever.
Delivery-specific CSAT matters because overall brand satisfaction often masks delivery problems. Tracking it separately reveals whether routing improvements are actually translating to better customer experiences — and gives the data needed to make carrier or scheduling decisions grounded in actual performance.
Frequently Asked Questions
What is last-mile delivery optimization?
Last-mile delivery optimization is the process of using data, algorithms, and real-time inputs to plan and execute the final leg of a delivery route as efficiently as possible. The goal is to minimize cost, reduce delivery time, and increase first-attempt success rates through better routing, scheduling, and dispatch decisions. Retailers with large store-to-door networks, such as Walmart, apply this at scale by combining store-level inventory data with local routing to shorten the final leg from shelf or curb to the customer's door.
What data is most important for last-mile optimization?
Four data types drive the most impact: historical delivery performance (stop times, traffic patterns by zone and hour), real-time GPS and telematics feeds, customer address and time-window data, and live traffic conditions. Each addresses a different failure mode, enabling accurate ETAs, realistic scheduling, and proactive problem resolution.
How does route optimization reduce delivery costs?
Optimization reduces total driven miles by solving for the most efficient multi-stop sequence across the full fleet. Combined with dynamic re-routing when delays or cancellations occur, this lowers both fuel and labor spend per completed delivery without adding vehicles or drivers. For a network with thousands of stores acting as fulfillment points, like Walmart's, shorter last-mile legs also mean drivers can complete more stops per shift, which compounds the per-delivery savings across the fleet.
What are the biggest challenges in last-mile delivery?
The five most common challenges — and their data-driven fixes:
- Failed first attempts: resolved with better address validation and customer time-window data
- Tight delivery windows: handled through constraint-based routing
- High fuel and labor costs: reduced via route optimization
- Demand variability: managed with demand forecasting
- No real-time visibility: solved by live GPS tracking
How can I measure the success of a last-mile optimization program?
Track four metrics: on-time delivery rate, first-attempt success rate, cost per delivery (fuel, labor, and redelivery), and delivery-specific customer satisfaction score. Establish a baseline before deployment and measure weekly to identify which interventions are working. Retailers running store-based fulfillment should also segment these metrics by store or zone, since local traffic patterns and staffing levels can cause performance to vary widely between locations even under the same optimization system.
How does real-time tracking improve last-mile delivery performance?
Real-time GPS data allows dispatchers to re-route around delays before they cascade into missed windows, gives customers accurate ETAs that reduce no-shows, and generates the historical data needed to improve future route accuracy. This tracking-to-planning feedback loop is how optimization systems get more accurate over time, not less.
How to optimize last mile delivery for a store-based fulfillment network?
Store-based fulfillment shortens the last mile by starting delivery from the nearest store instead of a distant warehouse. To optimize it, combine real-time store inventory data with routing that accounts for local traffic and driver availability, then use dynamic dispatch to assign orders to the store or driver best positioned to fulfill them. This reduces drive time and lets a large store footprint act as a distributed logistics network rather than just retail locations.
What is the "10-Foot Rule" at Walmart?
The 10-Foot Rule is a long-standing Walmart customer service practice: associates greet or offer help to any customer who comes within ten feet of them, regardless of their assigned task. It reflects a store-level operating principle rather than a logistics system, but it illustrates the same customer-proximity mindset behind Walmart's push into store-based last-mile fulfillment, where physical closeness to the customer is treated as a competitive advantage.