Introduction
Inefficient delivery routes in last-mile logistics are caused by manual dispatch planning that can't process real-world constraints, poor address data leading to failed attempts, lack of real-time visibility into traffic and driver location, and fixed fleet capacity that can't flex with demand spikes. You can run a flawless warehouse operation, nail your middle-mile freight, and still lose a customer in the final three miles. That's the cruel reality of last-mile delivery: it's where supply chains succeed or fail in the eyes of the people who actually matter — your customers.
The numbers reinforce why this deserves serious attention. According to the Capgemini Research Institute's study of 500 supply-chain executives, last-mile delivery accounts for 41% of overall supply-chain costs — yet the average delivery costs $10.10 to execute while customers are charged only $8.08. That $2 gap adds up fast across thousands of deliveries.
These pressures don't exist in isolation. The core pain points facing logistics operators today include:
- Rising fuel and labor costs eroding already-thin margins
- Customers demanding real-time delivery visibility
- Failed first-delivery attempts triggering costly re-dispatch
- Unpredictable peak demand overwhelming fixed-capacity fleets
This article covers five specific, actionable solutions — each targeting one of these problems directly, with concrete tactics you can evaluate and act on.
Key Takeaways
- Cut route waste with AI-powered optimization that accounts for traffic, time windows, vehicle constraints, and driver schedules simultaneously.
- Prevent failed deliveries by fixing address data quality upstream and giving customers control over their delivery windows.
- Protect customer loyalty through real-time tracking and proactive exception communication — even late deliveries preserve satisfaction when customers hear first.
- Absorb demand surges without over-investing in fixed fleet assets by building hybrid capacity with 3PL and gig delivery partners.
- Measure what matters: cost per delivery, on-time rate, and first-attempt success — tracked together to avoid false efficiency gains.
Why Last-Mile Logistics Is So Costly and Complex
Most freight moves in bulk between two nodes: a warehouse ships a full truckload to a distribution center. Last-mile flips that model entirely. Instead of one truck making two stops, you have one truck making 40 individual stops across a fragmented urban or suburban area. Labor, fuel, and vehicle costs are now spread across dozens of tiny transactions rather than one large one.
That structural inefficiency is what drives last-mile's disproportionate cost share. Capgemini's research found that online delivery orders are 19% less profitable than in-store orders — not because the products change, but because the delivery economics are fundamentally harder.
The compounding effect makes this worse. Poor routing wastes fuel, which raises cost per delivery. A late delivery triggers a customer service call, costing staff time. A failed attempt means a full redelivery run. Each failure doesn't just add one cost — it multiplies across the operation. This is also where safety risk concentrates: last-mile drivers face repeated stop-and-go maneuvers, tight parking, and pedestrian-heavy areas, and rushed schedules driven by inefficient routing only add to that exposure.
Key cost drivers in last-mile logistics:
- High stop density fragmentation (40+ stops vs. 2-node bulk freight)
- Labor costs dominating per-unit economics
- Fuel and vehicle depreciation spread thinly across individual deliveries
- Customer service overhead from poor visibility or failed attempts
- Redelivery costs compounding initial failures
Reactive fixes — adding drivers, issuing blanket discounts for late deliveries, hiring more call center staff — address symptoms without touching the structural problems. The five solutions below go after the root causes instead.
Solution 1: Adopt AI-Powered Route Optimization
Why Manual Routing Breaks at Scale
Dispatchers working with spreadsheets or basic mapping tools face a mathematically intractable problem. Route optimization is classified as NP-hard in computer science — meaning the number of possible route combinations grows exponentially with every additional stop. A human reviewing options across 30–40 stops simply cannot find the optimal sequence, even with experience and good instincts.
The practical result: routes that are longer than they need to be, fuel budgets that consistently run over, and drivers finishing shifts later than planned.
How AI Optimization Solves This
AI-driven route optimization processes dozens of real-world variables simultaneously to generate the most efficient stop sequence before a driver leaves the depot. Platforms like NextBillion.ai's Route Optimization API handle more than 50 hard and soft constraints in a single optimization pass, including:
- Time windows with configurable lateness tolerances for delivery slots that must be honored
- Vehicle capacity and dimensions — weight limits, height restrictions, cargo type compatibility
- Driver schedules covering working hours, mandatory rest breaks, and labor compliance
- Road restrictions for truck-restricted roads, bridge weight limits, and HAZMAT routing
- Order priority and task sequencing so urgent deliveries are processed before routine stops
- Real-time and historical traffic data to account for current conditions and predictable patterns
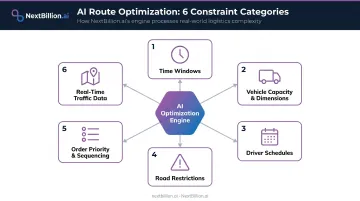
That entire process runs in seconds — compared to the hours manual planning routinely consumes.
Dynamic Re-Routing After Dispatch
Pre-dispatch planning is only half the equation. Traffic incidents, order cancellations, and same-day additions are regular features of last-mile operations. AI platforms handle these mid-route by inserting new orders or rerouting drivers with minimal disruption to the original plan.
Xpress Global Systems, a Tennessee-based transportation provider, documented a 13% reduction in miles driven per month after implementing AI-powered route optimization — while maintaining existing service levels. A health-tech logistics company using similar optimization capabilities achieved 35% more visits per rider while lowering conveyance costs by 25%.
For context at a larger scale: UPS's ORION route optimization program avoided 100 million miles annually, delivering an estimated $300–$400 million in savings and cost avoidance.
Solution 2: Provide Real-Time Tracking and Proactive Customer Communication
The Visibility Gap Costs More Than You Think
Customers don't just want their delivery to arrive on time — they want to know where it is. A broad morning/afternoon window no longer meets expectations. When visibility is absent, customers call support, and if the experience is bad enough, they don't come back. This lack of visibility is one of the clearest downsides of last-mile logistics: it drives up support costs, erodes trust, and masks the routing problems causing the delays in the first place.
Metapack's 2022 survey of 3,000+ UK, French, and German consumers found:
- 70% of UK consumers are less likely to shop with a retailer after hearing about a negative delivery experience
- Over 35% stopped shopping with a retailer after just one negative delivery experience
- Over 60% shared their negative experience with friends and family
These aren't just satisfaction scores. They're retention and revenue figures.
Proactive Communication Preserves Satisfaction Even When Delays Happen
The fix isn't always the delay itself — it's the communication around it. A 2026 Locus survey of 3,000 US and UK shoppers found that 93% of US consumers said proactive updates offset the negativity of a late delivery. Proactive outreach consistently outperforms the reactive apology call.
That communication depends on real-time GPS data flowing to the right places at once:
- Customer-facing alerts: SMS or email updates triggered by geofences — for example, a notification when the driver is 30 minutes out
- Dispatcher dashboards: Live driver maps that surface delays early, before a single late stop cascades into a broken route
- Operations-side intervention: Early visibility lets dispatchers reroute or reassign before customers notice a problem
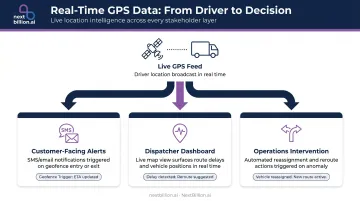
NextBillion.ai's Live Tracking API supports real-time fleet monitoring with up to 1-meter location accuracy, configurable geofence-based alerts, and route-deviation notifications — giving dispatchers early warning of delays and customers accurate ETAs before they have a reason to call.
Solution 3: Reduce Failed First-Delivery Attempts
Failed first-delivery attempts are expensive in ways that don't always appear in obvious budget lines. Beyond the direct redelivery cost — IMRG's analysis of 120 million orders across the UK found an average carrier cost of £1.65 (~$2.10) per repeat delivery attempt — there's the downstream impact: driver time, fuel, lost productivity, and customer frustration.
The leading causes fall into three distinct categories, each requiring a different fix:
| Cause | Fix |
|---|---|
| Incorrect or incomplete address data | Address verification and geocoding before dispatch |
| Customer not home during delivery window | Customer-controlled scheduling and safe drop-off authorization |
| GPS errors in new developments or non-standard areas | Custom map data and editable road network tools |
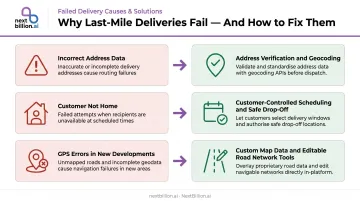
Fixing Address Data Before Dispatch
Address problems that reach the driver are address problems that cost money. Resolving ambiguous or incomplete delivery points upstream — before route planning begins — eliminates many failures at the source.
NextBillion.ai's Road Editor App lets operations teams correct inaccuracies in underlying map data, add access points for new developments, configure road restrictions, and mark precise entry/exit points for delivery locations.
For businesses in areas where conventional map data lags behind real-world conditions — new housing developments, industrial parks, remote sites — this directly reduces the GPS-error category of failed deliveries.
Giving Customers Control Over Their Window
The customer-not-home failure is harder to fix on the carrier's side because it's fundamentally a coordination problem. Giving recipients the ability to select or adjust their delivery window in advance — or to provide safe drop-off instructions — shifts part of the responsibility where it belongs.
Proactive ETA notifications as the driver approaches close the loop: recipients who know when their package is 20 minutes out are far more likely to be available — or to have already arranged a safe drop-off. That's two of the three failure categories handled before the driver ever leaves the depot.
Solution 4: Build Flexible Delivery Capacity for Peak Demand
The Static Fleet Trap
The economics of peak demand create a genuine dilemma. Build a fleet large enough to handle holiday surge volumes and you're carrying expensive idle capacity 10 months of the year. Under-build and you miss SLAs precisely when customer attention — and acquisition costs — are at their peak.
Carrier data illustrates the cost pressure clearly. UPS's 2025 demand surcharge schedule includes charges of $0.60 per Ground Residential package rising to $2.05 per air package during the Nov. 23–Dec. 27 peak window, with volume-based tiers reaching $7.50–$8.75 per package. For businesses routing significant volume through carrier networks during peak, those surcharges add up fast.
The Hybrid Capacity Model
The practical answer is a core fleet that handles baseline volume reliably, backed by relationships with 3PL carriers, regional couriers, or gig delivery networks that activate on demand.
The data backs this up. During November 2024's peak season, project44's analysis of 1.5 billion+ annual shipments showed shippers increased carrier diversification by 5% from October to November. Operators who pre-built those flexible capacity relationships outperformed those stuck managing fixed-fleet constraints.
What flexible capacity planning requires:
- Pre-negotiated overflow agreements with 3PL or regional partners before peak arrives
- Technology that can route across mixed fleets — owned vehicles and third-party drivers in the same optimization pass
- Per-order or per-delivery pricing models that scale with actual volume rather than fixed per-API-call costs
That last requirement matters most during surge. NextBillion.ai's per-order pricing means businesses pay based on actual deliveries completed — not API call volume — so costs scale with real activity rather than spiking when multi-provider routing complexity increases.
Solution 5: Track the Right KPIs to Drive Continuous Improvement
Investing in technology or process changes without establishing baseline metrics is a reliable way to miss the improvement you paid for. Operations teams often can't demonstrate ROI because they never measured the starting point — and they can't identify remaining gaps because they're only watching one number.
The Five Core Last-Mile KPIs
| KPI | What It Reveals |
|---|---|
| Cost per delivery | Total operational spend per unit; the foundational efficiency metric |
| On-time delivery rate (OTDR) | Whether routing, capacity, and scheduling actually serve the customer |
| First-attempt success rate | Address data quality, customer communication, and scheduling effectiveness |
| Stops per route / miles per stop | Route density and driver productivity |
| Returns rate | Downstream quality; NRF estimated 16.9% of 2024 retail sales would be returned |
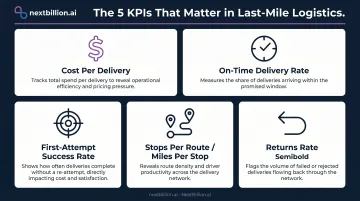
Why You Must Track Them Together
Tracking any single metric in isolation creates blind spots. Cut cost per delivery while your on-time rate drops, and you haven't improved — you've deferred the cost into customer churn. A rising first-attempt success rate paired with a climbing returns rate tells a different story: customers are home to accept packages they've already decided to send back.
The diagnostic value comes from tracking the full set over time. When one metric improves at the expense of another, the combined view surfaces the trade-off immediately. When all five move in the right direction together, you can attribute specific process changes to specific outcomes — and build the case for what to do next.
Closing the loop between planning and execution is where most teams lose visibility. NextBillion.ai's Route Reconstruction API maps the roads drivers actually took against the planned sequence, providing segment-level attributes including speed, deviations, and stop timing. That data feeds directly into OTDR and stops-per-route analysis without requiring a separate telematics layer.
Frequently Asked Questions
What is the reason for inefficiency in logistics and delivery?
The core drivers are poor route planning, fragmented stop density, address data errors, and lack of real-time visibility into what's happening on the road. Each of these creates exceptions — late deliveries, failed attempts, reactive rerouting — that compound into systemic inefficiency rather than isolated incidents.
What percentage of total shipping costs does last-mile delivery typically account for?
According to Capgemini's research, last-mile delivery accounts for 41% of overall supply-chain costs. Deloitte puts the figure at 30–35% of total delivery cost using a narrower denominator — but every framework points to last-mile as the single most expensive segment in the supply chain.
How does route optimization software reduce last-mile delivery costs?
Route optimization reduces wasted mileage, lowers fuel and labor costs per stop, and fits more deliveries per vehicle per day by finding the most efficient stop sequence under real-world constraints. It also cuts the cost of late deliveries by building realistic, constraint-aware routes before drivers leave the depot.
What is the biggest challenge in last-mile delivery?
Rising customer expectations for speed and real-time visibility, combined with the high cost structure of individual-stop delivery, are the hardest pressures to manage simultaneously. Neither yields to a single fix — closing the gap requires parallel investment in routing, tracking, and customer communication. Driver safety in dense urban and residential zones, where frequent stops and tight schedules raise collision risk, adds another layer that routing decisions directly influence.
How can businesses reduce failed first-delivery attempts?
The primary levers are address verification before dispatch, customer-controlled delivery window scheduling, proactive ETA notifications, and safe drop-off authorization. Fixing inaccurate map data for non-standard locations — through tools like editable road network platforms — addresses the GPS-error category separately. Route sequencing that accounts for real-world constraints such as delivery windows, vehicle access, and traffic conditions reduces the rushed, out-of-window arrivals that often trigger a failed attempt in the first place.
What metrics should you track to measure last-mile delivery performance?
The essential baseline metrics are cost per delivery, on-time delivery rate, first-attempt success rate, and stops per route. Tracking all four together matters most — an improvement in stops per route that drives down first-attempt success rate signals a trade-off, not a win.
What is the leading cause of accidents in the last mile delivery industry?
Driver fatigue and time pressure from tight delivery windows are widely cited as leading contributors, compounded by distracted driving and frequent stop-and-go patterns in residential and urban areas. These conditions are recognized in general logistics safety discussions tied to hours-of-service and FMCSA guidance for commercial driving. Reducing route inefficiency and unrealistic delivery windows lowers the pressure that leads to rushed, unsafe driving behavior.
How to optimize last mile delivery?
Optimization starts with accurate address and road network data, followed by route sequencing that reflects real-world constraints like delivery windows, vehicle capacity, and traffic. Layering in real-time tracking and proactive customer notifications reduces failed attempts and reactive rerouting. Measuring cost per delivery, on-time rate, and first-attempt success together — rather than in isolation — keeps optimization efforts from trading one metric for another.