With U.S. parcel volume hitting 22.37 billion shipments in 2024 and e-commerce volumes still climbing, the pressure on last mile operations has never been greater. This article explains what last mile delivery actually is, why it's so difficult, and — practically — what you can do to improve it.
Key Takeaways
- Last mile delivery is the final movement of goods from a distribution hub to the customer's door — and it accounts for over half of total shipping costs
- The core problems: fragmented stops, traffic, failed deliveries, driver shortages, and demand unpredictability
- Top improvement levers: intelligent route optimization, real-time tracking, localized inventory, electronic proof of delivery, and flexible delivery options
- Route optimization software handling 50+ real-world constraints consistently outperforms manual planning and generic mapping tools
- AI-powered platforms learn from historical delivery data to sharpen ETAs, cut wasted miles, and enable mid-shift re-routing
What Is Last Mile Delivery?
Last mile delivery is the final movement of goods from a distribution hub or fulfillment center to the end customer — whether that's a residential address, a retail location, or a designated pickup point. The "last mile" label is a misnomer in practice, this leg can span anywhere from a few blocks in a dense urban core to 50+ miles in rural territory. A typical example is a courier pulling a package off a delivery van at a regional hub and driving it directly to a homeowner's front porch, handling every turn, parking maneuver, and doorstep handoff along the way.
Where It Fits in the Supply Chain
The full delivery chain has three stages:
- First mile — goods move from manufacturer or supplier to a regional distribution hub
- Middle mile — bulk transport between hubs, typically via long-haul trucking or rail, optimized for volume and efficiency
- Last mile — the hub-to-customer leg, where volume fragments into individual stops and complexity spikes
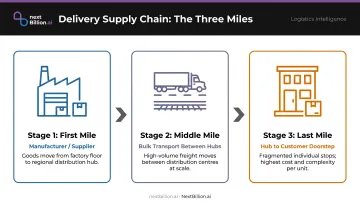
The first two stages benefit from economies of scale: full trucks, predictable routes, consolidated loads. Last mile has none of that. Each stop is unique, customer availability varies, and every neighborhood adds its own routing wrinkle.
What Is Last Mile Driving?
Last mile driving refers to the physical driving a delivery driver performs on that final leg. It means navigating local roads, juggling 50–150 stops per shift, handling customer interactions, and confirming every drop — often while traffic, parking, and last-minute reroutes pile on simultaneously. During this leg, the driver typically loads stops in sequence, follows a planned or ad-hoc route, attempts each delivery, captures proof of delivery, and adjusts on the fly when an address is inaccessible or a customer is unavailable.
That stop density is what separates last mile driving from freight. A long-haul driver runs a single route between known endpoints. A last mile driver reacts to a different set of conditions at every door.
The Last Mile Problem: Why It's the Most Expensive Leg
The structural inefficiency of last mile delivery stems from a mismatch in scale. Long-haul logistics is built for bulk: one truck, one driver, hundreds of miles, one destination. Last mile flips that entirely — one truck, one driver, dozens of stops, a few square miles.
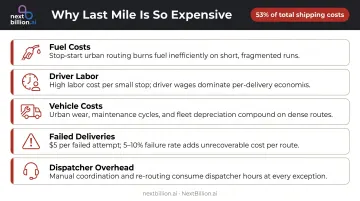
Accenture's research puts last mile at 53% of total shipping costs and 41% of total supply chain costs — a disproportionate share given the short distances involved. The reasons stack up quickly:
Primary cost drivers:
- Fuel consumption from constant stop-start urban routing
- Driver labor allocated across many small stops rather than one long run
- Vehicle acquisition, maintenance, and insurance
- Failed delivery attempts requiring costly re-delivery (Accenture estimates each failed attempt costs around $5, and 5–10% of last mile deliveries fail)
- Dispatcher overhead managing unpredictable variables — traffic, access restrictions, customer no-shows
Why It's Getting Harder
The problem isn't static. Several forces are making it worse:
- E-commerce growth keeps shifting volume toward residential addresses, which are harder and slower to service than commercial stops
- Customer expectations have compressed acceptable delivery windows — same-day and next-day delivery are now table stakes for many categories
- Driver shortages tighten capacity at exactly the wrong time; the American Trucking Associations reported a shortage of 78,800 qualified drivers in 2022
The global last mile delivery market was valued at $167.36 billion in 2025 and is projected to reach $348.85 billion by 2033, according to Grand View Research. That growth lands on a system already strained by rising costs and shrinking driver availability — which is why process and technology improvements have moved from optional to essential.
Top Challenges in Last Mile Delivery
Last mile delivery fails in predictable ways — and each failure type has a distinct cost profile.
Urban Congestion and Infrastructure
Dense cities create a compounding problem: more stops per square mile sounds efficient, but narrow streets, restricted loading zones, and peak-hour gridlock add significant time per stop. The Texas A&M Transportation Institute put truck congestion costs at $27.1 billion in 2022, with 46% concentrated in just the 15 largest urban areas.
Every extra minute a driver spends circling for parking or stuck at a light is cost with no delivery to show for it.
Rural and Low-Density Delivery
Rural routes present the inverse problem. Long gaps between stops, deteriorating road quality, and fuel burn per delivery all spike in low-density areas. Carriers face a lose-lose: sparse stops mean high cost-per-delivery, but skipping rural customers isn't an option.
Failed Deliveries
When no one is home or a building is inaccessible, the entire stop cost is wasted. With 5–10% of last mile deliveries failing on the first attempt, the downstream consequences stack up quickly:
- Re-delivery labor and vehicle costs for a second attempt
- Customer service calls from recipients tracking missing orders
- Potential returns if the item can't be delivered at all
- Negative reviews and reduced repeat purchase rates
Demand Unpredictability
Holiday surges, flash sales, and same-day order spikes create planning chaos. Fleet managers can't hire drivers or acquire vehicles overnight — which means either excess capacity sitting idle in slow periods or missed deliveries during peaks. USPS, which expanded daily package processing capacity to 60 million packages for the 2024 holiday season, still faces the same fundamental constraint: physical capacity takes time to build.
Visibility Gaps
Without real-time tracking and proactive ETAs, two problems emerge simultaneously: customers escalate service calls when they don't know where their package is, and dispatchers lose the ability to course-correct mid-route when delays occur.
The result is a dual cost: dissatisfied customers and a dispatch team firefighting instead of planning.
How to Improve Last Mile Delivery
Optimize Routes Intelligently, Not Manually
Manual route planning at any meaningful scale is untenable. Even experienced dispatchers working with spreadsheets can't account for dozens of simultaneous variables — traffic patterns, time windows, vehicle loads, driver shift limits — across a full fleet in a reasonable time.
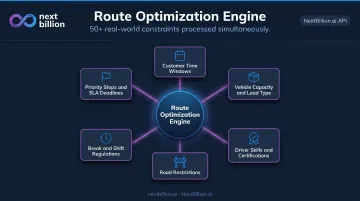
Purpose-built route optimization software solves this. The best platforms handle 50+ real-world constraints simultaneously, including:
- Customer time windows and service durations
- Vehicle capacity and load type restrictions
- Driver skills and certification requirements
- Road restrictions (height, weight, hazmat)
- Break and shift regulations
- Priority stops and SLA deadlines
This is where the gap between generic tools and purpose-built platforms matters. Google Maps' Distance Matrix API supports a 25×25 matrix — meaning 25 origins and 25 destinations per request. NextBillion.ai's Distance Matrix API supports up to 5,000×5,000 elements, a 200x increase that eliminates the need to fragment large routing problems into multiple chained requests.
For fleets running dozens of vehicles with hundreds of stops, that's not a minor technical detail. It determines whether you're getting real optimization or a series of approximations stitched together.
NextBillion.ai's Route Optimization API processes up to 10,000 stops and returns results in seconds, with dynamic re-optimization available mid-route when conditions change. Xpress Global Systems, a Tennessee-based shipping provider, achieved a 13% reduction in miles driven per month and a 35% reduction in operating costs after switching to NextBillion.ai.
Leverage Real-Time Tracking and Driver Communication
Real-time GPS visibility delivers two distinct payoffs:
- For dispatchers: mid-route corrections — re-routing around accidents or inserting urgent stops without disrupting the rest of the schedule
- For customers: automated ETA notifications and tracking links that reduce the uncertainty driving failed deliveries and repeat service calls
NextBillion.ai's Live Tracking API provides location updates with up to 1-meter accuracy, with offline tracking that maintains location history in low-connectivity areas. Its Geofencing API can automatically trigger customer alerts as a driver approaches — a simple mechanism that meaningfully improves first-attempt delivery rates.
Use Localized Inventory and Strategic Warehousing
The shorter the last mile, the cheaper and faster it gets. Positioning inventory closer to customers through micro-fulfillment centers, dark stores, or urban warehouses directly cuts distance and delivery time. Accenture modeled the impact of fulfilling 50% of e-commerce orders through local centers in London and Chicago — the result was 140 million fewer kilometers driven and a 13% reduction in delivery traffic in each city.
The micro-fulfillment market is growing rapidly in response: Technavio projects $67.31 billion in market growth between 2023 and 2028 as operators build out urban fulfillment capacity.
Implement Electronic Proof of Delivery
Failed delivery claims, billing delays, and porch theft disputes share a common fix: electronic proof of delivery (ePOD). Photo capture, digital signatures, and GPS-tagged confirmation close several operational gaps at once:
- Eliminates delivery disputes and the manual resolution process that follows
- Speeds billing cycles by confirming completion instantly
- Deters porch theft and protects both sender and recipient
- Creates the delivery audit trail needed to improve future route planning
NextBillion.ai's Driver App integrates ePOD directly into the route execution workflow. Drivers capture signatures or photos at the point of delivery; dispatchers receive real-time job completion status. Because it's built into the same system used for routing and tracking, there's no separate tool to manage or reconcile.
Offer Flexible Delivery Options to Reduce Failed Attempts
Giving customers control over their deliveries is one of the highest-leverage ways to cut failed attempt rates. Options include:
- Customer-selected time windows aligned with actual availability
- Redirect to parcel lockers or alternate pickup points when no one will be home
- Special delivery instructions (access codes, preferred drop-off locations) surfaced to drivers in the navigation app
The out-of-home delivery model is growing fast — McKinsey projects out-of-home parcel volume in major European markets will grow by 1.3 billion parcels by 2027, versus just 200 million for home delivery. Kearney research shows parcel lockers can reduce per-delivery costs by up to 25% compared to door delivery.
How Route Optimization Technology Powers Better Last Mile Performance
Route optimization software does something a spreadsheet or dispatcher never could. It ingests order data, vehicle parameters, driver constraints, traffic patterns, and service time estimates simultaneously, then generates the most efficient sequence and path for each driver in seconds rather than hours.
Modern Platforms vs. Generic Mapping Tools
The distinction matters for last mile operators. Google Maps and similar consumer-grade tools were built for navigation, not logistics dispatch. The practical gaps:
| Capability | Google Maps Platform | NextBillion.ai |
|---|---|---|
| Distance Matrix size | 25×25 | 5,000×5,000 |
| Optimization constraints | None | 50+ |
| Truck-compliant routing | No | Yes |
| Dynamic re-optimization | No | Yes |
| Pricing model | Per API call | Per vehicle / per order / fixed monthly |
The pricing difference compounds at scale. Google's per-call model means costs spike unpredictably during peak periods. NextBillion.ai's per-order pricing absorbs demand spikes without bill growth — a meaningful advantage for last mile operations managing holiday surges.
The Impact of Route Optimization
UPS's ORION system, one of the most documented deployments of route optimization at scale, has saved approximately 100 million miles and 10 million gallons of fuel per year since deployment, avoiding an estimated 100,000 metric tons of greenhouse gas emissions annually. Accenture's research puts typical route optimization efficiency gains at 7–15% across the industry.
AI and Machine Learning in Practice
Static optimization plans a route. Machine learning keeps improving it. NextBillion.ai's platform applies ML across three areas that directly affect delivery performance:
- Learns from historical delivery data to sharpen service time estimates over time
- Combines real-time and historical traffic signals for more accurate ETAs
- Re-routes drivers mid-shift when road conditions or order changes demand it
The results across customer deployments are consistent:
- GOIN (NEMT): 95% arrival time accuracy, driver idle time down 30% via automated dispatch
- European TMS provider: 30% improvement in ETA and ETD accuracy
- Indian logistics firm: ETA accuracy up 37%, infrastructure costs down 40%
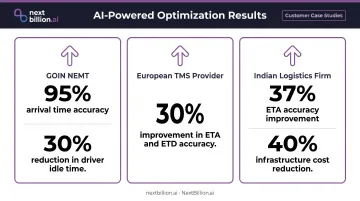
For last mile operators, the compounding effect matters most — better ETAs reduce customer service overhead, while fewer idle miles cut fuel spend and driver hours simultaneously.
Frequently Asked Questions
What is last mile driving?
Last mile driving is the physical driving a delivery driver performs on the final leg of a shipment — navigating local roads, making multiple customer stops, and completing deliveries directly to homes, businesses, or designated pickup points. Unlike long-haul driving, it's defined by high stop density, unpredictable conditions, and direct customer interaction.
What is first mile vs. last mile?
First mile is the initial movement of goods from a manufacturer or supplier to a distribution hub. Last mile is the final delivery from that hub to the end customer. Last mile is typically the more costly and complex of the two — fragmented stops, unpredictable customer availability, and no opportunity to consolidate loads all drive up cost and effort.
What percentage of delivery cost is last mile?
Last mile delivery commonly accounts for around 53% of total shipping costs, according to both Business Insider and Accenture. The high share reflects the labor-intensive, stop-heavy, and unpredictable nature of local delivery compared to the optimized bulk transport that precedes it.
What are the biggest challenges in last mile delivery?
The main challenges are urban traffic congestion, failed first-attempt deliveries (5–10% of all attempts), driver shortages, rising customer expectations for same-day or next-day speed, and the fundamental inefficiency of making many small dispersed stops rather than bulk deliveries. In the US, this is compounded by suburban sprawl, gated communities, apartment access codes, and FMCSA hours-of-service limits that cap how long a driver can stay on the road each shift.
How does route optimization improve last mile delivery?
Route optimization reduces wasted mileage, improves on-time delivery rates, lowers fuel costs, and enables dispatchers to handle more stops per driver. Platforms that model 50+ real-world constraints — time windows, vehicle capacity, driver skills, road restrictions — consistently outperform basic shortest-path logic. For US fleets, factoring in driver hours-of-service limits, local delivery windows, and weight or size restrictions on residential roads helps keep routes both efficient and compliant.
What is the last mile delivery problem?
The last mile problem is the structural inefficiency where the shortest physical leg of delivery generates the highest cost and complexity. Fragmented stops, customer availability issues, traffic, and demand unpredictability all concentrate at the final mile, making it the hardest and most expensive segment of the entire supply chain to get right.
How expensive is last mile delivery?
Last mile delivery is the most expensive segment of the shipping process because it involves many small, dispersed stops instead of bulk transport. Costs are driven by driver labor, fuel, failed delivery attempts, and time lost navigating traffic or searching for addresses. Businesses that plan routes with real-world constraints in mind, rather than relying on manual dispatching, typically see lower per-stop costs over time.
What does the last mile refer to?
The last mile refers to the final leg of a delivery journey, from a local hub, warehouse, or distribution center to the end customer's door. It is the shortest distance in the overall shipping process but the most operationally complex, since it involves navigating local roads, multiple stops, customer availability windows, and access issues that bulk transport legs do not face.