
That's exactly what a travel time matrix solves. It's a structured table capturing estimated travel time between every combination of origin and destination points in a given location set — the computational backbone behind route optimization, ETA prediction, and service area analysis.
This guide covers the mechanics of how matrices work, where they're applied across industries, what determines accuracy, and how the major tools compare — so you can make the right call for your operational scale.
Key Takeaways
- A travel time matrix (also called an O-D matrix) computes travel times between every origin-destination pair simultaneously, not one at a time.
- It underpins route optimization, delivery scheduling, field service dispatching, and accessibility analysis.
- Accuracy depends on how current the road network is, how well traffic is modeled, time-of-day conditions, and whether the tool supports your vehicle type.
- Google Maps Distance Matrix API caps requests at 100 elements (25 origins or 25 destinations), which creates real bottlenecks at logistics scale.
- Choosing the right tool comes down to matrix size, pricing model, traffic awareness, and integration fit with your optimization layer.
What Is a Travel Time Matrix and How Does It Work?
A travel time matrix is an M×N grid where each cell [i,j] holds the estimated travel time from origin i to destination j. The computation solves the shortest-path problem across a road network for every origin-destination pair simultaneously. In practice, the formula for calculating each cell's travel time sums the time cost of traversing each road segment along the fastest path, with segment costs set by speed limit, road class, turn restrictions, and current or historical traffic conditions.
The Underlying Computation
Shortest-path algorithms traverse a weighted graph of road segments, where each segment carries impedances that define how fast — or whether — a vehicle can travel it:
- Speed limits and road class
- Turn restrictions and one-way rules
- Live or historical congestion data
The algorithm finds the minimum-time route for every origin-destination pair in the matrix.
Modern routing engines like OSRM use Contraction Hierarchies (CH) and Multi-Level Dijkstra preprocessing rather than running raw Dijkstra from scratch for every query. OSRM's documentation notes that CH is particularly well-suited for large distance matrices because shortcut preprocessing dramatically reduces query time.
Travel Time vs. Distance Matrix
These terms get conflated, but they measure different things:
| Distance Matrix | Travel Time Matrix | |
|---|---|---|
| Unit | Kilometers or miles | Minutes or seconds |
| Path basis | Shortest physical route | Fastest route |
| Traffic-aware | No | Yes (in quality APIs) |
| Best for | Area coverage analysis | Routing and scheduling |
A longer highway route is often faster than a shorter surface-street route. That divergence is why travel time is the more operationally useful metric for dispatching and ETA modeling. A distance matrix is calculated the same way structurally — as an M×N grid of origin-destination pairs — but each cell holds the shortest physical route length rather than the fastest route's duration, which is why the two matrices can rank the same pair of routes differently.
Output Format and Scalability
Once you've chosen travel time as your metric, the next practical question is how that data comes back. APIs typically return results in one of two formats:
- Long format (most common): rows with
origin_id,destination_id,travel_time - Wide/pivot format: square matrix useful for visual inspection
A concrete 3×3 example:
| Origin | Destination | Travel Time |
|---|---|---|
| Depot A | Stop 1 | 8 min |
| Depot A | Stop 2 | 14 min |
| Depot A | Stop 3 | 22 min |
| Depot B | Stop 1 | 11 min |
| Depot B | Stop 2 | 6 min |
| Depot B | Stop 3 | 19 min |
The r5py documentation illustrates this growth precisely: a 323×323 all-to-all matrix produces 104,329 rows. Scale that to 500×500 and you're at 250,000 computations. At that volume, an API with a 25×25 element cap or per-call pricing becomes the bottleneck — not your logistics problem.

Real-World Applications Across Industries
Last-Mile Delivery and Route Optimization
VRP solvers need the complete cost matrix between all stops before they can cluster or sequence anything. Without it, optimizers fall back on straight-line (Euclidean) estimates that consistently underrepresent real road conditions.
The scale of real-world last-mile operations makes this concrete: Amazon's 2021 Last Mile Routing Research Challenge dataset covers 9,184 historical routes across five US metro areas. A 2025 Data in Brief study describing a real-world last-mile dataset used distance and time matrices over nine days with 60–85 delivery stops per day — each day requiring a fresh matrix computation.
Field Service Dispatching
Field service companies — pest control, HVAC, healthcare — use travel time matrices to match the nearest or fastest-available technician to each job. The matrix gives dispatchers (or automated systems) the full picture of who's closest to what, across all technicians and all pending jobs simultaneously.
Hawx Smart Pest Control, for example, deployed NextBillion.ai's Distance Matrix API alongside route optimization and substantially cut the hours spent on daily scheduling within the first month, while reducing technician drive times through more accurate job assignment.
ETA Prediction and Accessibility Analysis
Two very different use cases, same underlying data:
- Logistics platforms pre-compute travel time matrices to generate delivery ETAs at order placement, before a route is even assigned, enabling accurate customer notifications and SLA management.
- EasyHealth achieved 95% accurate ETAs after implementing predictive ETA modeling backed by travel time matrix data.
- Urban planners and healthcare networks use O-D travel time matrices to measure population coverage. A 2020 Nature Medicine study found that 60.3% of the world's population lives within 10 minutes of a hospital or clinic by motorized transport, a finding derived directly from travel time matrix analysis across global O-D pairs.
What Affects the Accuracy of a Travel Time Matrix?
Road Network Freshness
Static or outdated road data misses new roads, closures, and speed changes. APIs backed by continuously updated map data produce measurably better results than those using stale datasets.
NextBillion.ai, for instance, updates its road network data (sourced from OpenStreetMap and TomTom) quarterly as standard, with faster cycles available on request. The platform's Road Editor App also lets operations teams make map changes that feed directly into matrix calculations:
- Add private roads and correct posted speed limits
- Mark temporary or permanent road closures
- Apply vehicle-specific restrictions (weight, height, hazmat)
Traffic Modeling
Travel time between the same O-D pair varies meaningfully based on time of day and day of week. The FHWA confirms that non-recurrent congestion alone accounted for 51.6% of peak-period congestion in Atlanta, and a multi-lane incident can increase travel times by as much as 205% compared to no-incident conditions.
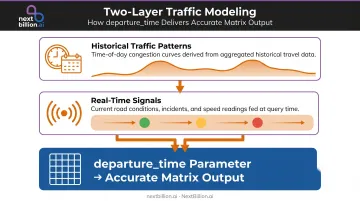
Quality travel time APIs handle this in two layers:
- Historical traffic patterns: model typical congestion for a given time of day
- Real-time signals: reflect current conditions at request time
Specifying a departure_time parameter in your API request is the mechanism that ties these together — the matrix output for a 7 AM departure will differ substantially from a 2 PM departure.
Vehicle Type
A 40-ton truck has a fundamentally different routing profile than a passenger car. Standard APIs compute times for passenger vehicles by default, but freight operations face a different set of constraints:
- Height and weight restrictions on bridges and tunnels
- Hazmat routing rules and road-class exclusions
- Lower average speeds on certain road types
For trucking, NEMT, or mixed-fleet operations, vehicle-aware routing profiles are a hard requirement.
Top Travel Time Matrix APIs and Tools Compared
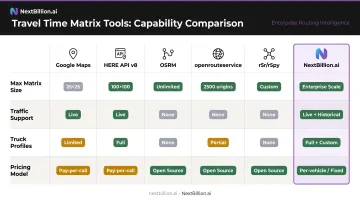
| Tool | Max Matrix Size | Traffic Support | Truck Profiles | Pricing Model |
|---|---|---|---|---|
| Google Maps Distance Matrix | 25 origins or 25 destinations; 100 elements/request | duration_in_traffic with departure_time |
No truck-specific profiles | Per element ($5.00–$10.00/1,000 elements) |
| HERE Matrix Routing API v8 | Up to 10,000 × 10,000 | Live + historical by departure time | Yes (height, weight, gross weight) | Base Plan; 30,000 transactions/month free |
| OSRM (self-hosted) | No documented cap | No built-in live traffic | Car, bicycle, foot profiles | Free / open-source |
| openrouteservice | No documented cap | Not documented in official sources | HGV, car, bike, walk, wheelchair | Open-source / API service |
| r5r / r5py | Tested at 323×323 (104,329 rows) | Multimodal via GTFS/OSM | Transit, walk, bike, car modes | Open-source research tools |
| NextBillion.ai | 5,000 × 5,000 (25M elements) | Real-time + historical; departureTime param |
Truck, HAZMAT, axle load, HOS | Per-vehicle, per-order, or fixed monthly |
Google Maps Distance Matrix API
Widely adopted and easy to integrate. Per Google's official documentation (last updated May 2026), the current limits are 25 origins or 25 destinations per request, with a 100-element maximum per request and 60,000 elements per minute. Pricing starts at $5.00 per 1,000 elements for the first 100,000 monthly elements, and $10.00/1,000 for traffic-aware (Advanced) requests. At logistics scale, those rates add up quickly — 10,000 elements per day runs $50–$100 before volume discounts apply.
HERE Matrix Routing API v8
Enterprise-grade option supporting matrices of up to 10,000 origins and 10,000 destinations. Truck mode accounts for height, current weight, and gross weight. Offers live and historical traffic by departure time. The Base Plan includes 30,000 free transactions per month with pay-as-you-grow pricing beyond that. If your operation involves mixed fleets — cars plus trucks with dimensional restrictions — HERE covers both in a single API.
Open-Source Tools (OSRM, openrouteservice, r5r/r5py)
For teams with infrastructure capacity, these tools offer matrix computation without per-call costs. The trade-off is setup and maintenance overhead rather than a subscription. Key differences:
- OSRM: Fast matrix computation using Contraction Hierarchies; car, bike, and foot profiles; no built-in live traffic
- openrouteservice: Supports HGV, car, bike, and wheelchair profiles; durations returned in seconds
- r5r/r5py: Purpose-built for multimodal accessibility analysis using GTFS + OSM; ideal for transit coverage studies
Trade-off: infrastructure overhead, no real-time traffic out of the box, and limited commercial support.
NextBillion.ai Distance Matrix API
NextBillion.ai's Distance Matrix API is designed for operations that exhaust the limits of standard tools — large fleets, complex truck constraints, or high-frequency replanning. Key differentiators:
- 5,000×5,000 matrix in a single request (25 million O-D pairs)
- 2×–3× lower latency and 10×–20× higher throughput than Google Maps Distance Matrix at equivalent scale
- Real-time + historical traffic with
departureTimeparameter - Truck profiles with HAZMAT, axle load, HOS compliance, and 50+ configurable constraints
- Custom road attribute editing feeds directly into matrix calculations
- Per-vehicle, per-order, or fixed-monthly pricing — not per-API-call
- Cloud-hosted (US, EU, APAC), cloud-agnostic (AWS/GCP/Azure), or on-premise Kubernetes deployment
- 99.9% uptime SLA
How to Choose the Right Travel Time Matrix Tool
Match Matrix Size to Your Operations
The size question is often the deciding factor:
- Under 25 origins and destinations daily: Google Maps or HERE free tier are workable
- 50–500 stops across multiple depots: You'll hit Google's 100-element cap immediately; HERE or NextBillion.ai are more appropriate
- Thousands of O-D pairs in near real-time: You need APIs that support large-batch computation without pagination overhead
Batching and stitching multiple small API requests to simulate a large matrix isn't just cumbersome — it introduces latency and consistency issues when traffic conditions change between calls.
Model Total Cost at Your Actual Volume
Per-call pricing looks reasonable at low volume and becomes dominant cost at scale. A worked example:
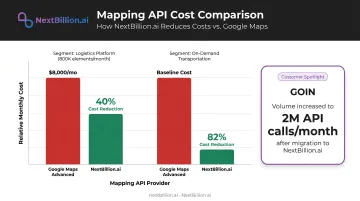
Assume a mid-size logistics operation making 800,000 distance matrix element calls per month (roughly comparable to GOIN's pre-migration volume):
- Google Maps (Advanced): $10.00/1,000 elements = $8,000/month
- NextBillion.ai (fixed pricing): structured as per-vehicle or per-order — GOIN achieved a 40% cost reduction versus their previous provider while nearly doubling call volume to 2 million API calls per month
A US-based trucking provider switching to NextBillion.ai's asset-based pricing model reduced API costs by 30%. An on-demand transportation company achieved an 82% reduction in API costs without any degradation in ETA accuracy.
Evaluate Integration Depth
Cost savings compound when the matrix API connects directly to your route optimization layer — eliminating the data transformation step between matrix generation and VRP solving. NextBillion.ai's Distance Matrix API and Route Optimization API are designed to work together: a European TMS provider integrated both to optimize route sequences while accounting for departure time, delivery windows, vehicle type, and loading time, achieving a 30% improvement in ETA accuracy and up to 40% savings on API costs.
Deployment model is the other variable to pin down. On-premise or cloud-agnostic options matter for data sovereignty, latency, and compliance. NextBillion.ai's on-premise deployment delivers up to 20× higher throughput compared to typical cloud deployments, with unlimited API calls at a fixed price.
Frequently Asked Questions
What is the difference between a travel time matrix and a distance matrix?
A distance matrix measures physical distance (kilometers or miles) between points using road-network or straight-line measurement. A travel time matrix measures time in minutes or seconds. They diverge significantly in practice because a longer highway route is often faster than a shorter surface-street route, making travel time the more useful metric for routing and scheduling decisions.
What is an O-D matrix in transportation?
O-D stands for Origin-Destination. An O-D matrix is a structured dataset representing interactions — trips, travel times, costs, or flows — between all pairs of origin and destination locations. Travel time matrices are a specific type of O-D matrix where the cell value represents travel time rather than distance or trip count. Transportation planners and dispatchers use O-D matrices to model demand between service areas, benchmark route efficiency, and feed routing and scheduling systems that need pairwise cost data rather than single point-to-point lookups.
What is the maximum matrix size for the Google Maps Distance Matrix API?
Per Google's official documentation, the current limit is 25 origins or 25 destinations per request, with a hard cap of 100 elements per request (where elements = origins × destinations). A 10×10 matrix exceeds this limit. At logistics scale, this forces batching and stitching of multiple calls, adding latency and cost. Fleet operators running daily route planning across hundreds of stops should check any provider's per-request limits before building a dispatch pipeline around it, since batching logic adds engineering overhead and points of failure.
How does a travel time matrix handle real-time traffic?
Traffic-aware APIs combine historical congestion patterns with live traffic feeds. A departure_time parameter controls which conditions apply — the matrix output for an 8 AM departure will differ from a noon departure. For logistics planning, match that window to your actual operations for accurate ETA modeling. Dispatchers should also re-run the matrix closer to actual departure when schedules slip, since traffic conditions and ETAs can shift meaningfully between a morning plan and afternoon execution.
Can a travel time matrix support truck-specific routing?
Standard APIs default to passenger-vehicle routing. Enterprise APIs offer truck-specific profiles that apply height, weight, and hazmat restrictions, use freight-appropriate speed profiles, and exclude roads closed to commercial vehicles. NextBillion.ai supports 50+ configurable truck constraints — including HAZMAT classification, axle load, and HOS compliance — while HERE's Matrix Routing API covers height, weight, and gross weight parameters.
How is a travel time matrix used in route optimization?
VRP solvers require a full cost matrix — travel time between every stop pair — before they can assign and sequence stops efficiently across a fleet. Without it, optimization falls back on Euclidean (straight-line) approximations that underestimate real-world travel times and produce suboptimal routes. The matrix is the input; the optimized route sequence is the output.
How is travel time calculated in a travel time matrix?
Routing engines calculate travel time by finding the road-network path between an origin and destination, then summing segment travel times based on speed limits, road class, and turn restrictions. Traffic-aware engines adjust each segment using historical or live congestion data rather than assuming free-flow speed. For a full matrix, this calculation repeats for every origin-destination pair, which is why matrix APIs are computationally heavier than single point-to-point requests.
How do you calculate a distance matrix?
A distance matrix is built by computing the road-network distance (not straight-line distance) between every origin and destination pair in a dataset, then arranging the results in a grid where rows represent origins and columns represent destinations. Routing APIs generate this by running a shortest-path calculation for each pair. For large stop counts, providers often batch requests due to per-call size limits, then stitch the results into one matrix.