The clearest illustration of what poor routing costs at scale: UPS's ORION system saves roughly 100 million miles and 10 million gallons of fuel per year across more than 66,000 routes. Those weren't miles UPS chose to drive — they were miles the company was driving before optimization identified them as unnecessary.
Transportation routing doesn't become expensive by default. It becomes expensive when decisions are made manually, without constraint-awareness, or without any feedback loop to catch what's going wrong. This article breaks down where those costs originate — and which strategies address each layer.
Key Takeaways
- Routing costs compound across fuel, labor, vehicle wear, and wasted capacity — and stay hidden until scale makes them impossible to ignore
- The biggest drivers: poor stop sequencing, underloaded vehicles, reactive planning, and ignoring real-world constraints
- Cost reduction works at three levels: route planning, in-execution management, and the structural constraints shaping your operating environment
- Pricing model choice matters — per-API-call costs balloon silently as fleet volume grows
- Sustained savings come from continuous auditing and KPI tracking — not a one-time software deployment
How Transportation Routing Costs Accumulate Over Time
Most routing cost problems don't announce themselves. There's no alert that fires when a driver takes a suboptimal sequence, no budget line item labeled "unnecessary miles," and no obvious moment when the inefficiency becomes visible. The costs build slowly, compounding across every vehicle, every shift, every week.
Consider the math: one extra mile per route, across a 50-vehicle fleet running 250 days a year, adds up to 12,500 unnecessary miles annually. At ATRI's 2025 benchmark of $2.26 per mile in average truck operating costs, that's over $28,000 in cost from a single mile of daily inefficiency per vehicle. Most fleets carry far more than one extra mile per route.
Why These Costs Stay Hidden
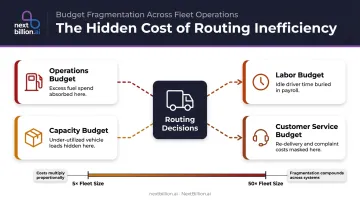
The deeper problem is that routing inefficiencies get absorbed rather than flagged:
- Excess fuel spend disappears into operating budgets without attribution to routing decisions
- Driver overtime becomes normalized when schedules routinely run long
- Underloaded vehicles complete routes that could have been consolidated — nobody calls this a routing failure
- Re-delivery costs get logged under customer service, not fleet operations
Each of these costs registers in a different budget category, which is exactly why they persist — no single report connects them back to routing decisions.
That fragmentation also means the losses compound quietly with scale. A 5-vehicle operation with suboptimal routes absorbs the inefficiency. A 50-vehicle fleet running the same per-route waste multiplies it across every shift, every day. At that point, routing isn't just a logistics problem — it's a measurable drag on margin.
Key Cost Drivers in Transportation Routing
Stop Sequence Inefficiency
The order in which stops are visited is one of the most underappreciated cost drivers in fleet operations. Suboptimal sequencing adds miles that look small on a single route but compound into thousands of unnecessary miles fleet-wide over time.
UPS local delivery drivers average 135 stops daily. At that volume, even minor sequencing improvements — skipping backtracking between adjacent stops, clustering by proximity rather than order of receipt — produce meaningful mileage reductions across a large fleet. ORION's projected $300–$400 million in annual savings at full deployment came primarily from recalculating those sequences at scale.
Vehicle Underutilization and Empty Miles
Stop sequence inefficiency inflates mileage. Empty miles inflate cost-per-delivery — and the two problems often compound each other.
When load planning is disconnected from route planning, vehicles run partially full — which means more trips to cover the same delivery volume. ATRI's 2025 data shows average empty mileage of 16.7% across commercial trucking. Eurostat found roughly 20% of EU road freight vehicle-kilometers were run empty.
Every empty mile costs the same to operate as a loaded one. At $2.26/mile, empty running is pure waste.
Reactive Routing
Routes built without traffic data, time-window awareness, or road-restriction logic force drivers into predictable delays. ATRI found that U.S. highway congestion added $108.8 billion to trucking costs in 2022 — equivalent to 1.2 billion hours of delay. Those delays don't stay on the road; they show up in your costs.
The downstream costs:
- Overtime pay when drivers can't complete routes within shift hours
- Failed first-attempt deliveries (Loqate found 8% of domestic deliveries fail on first attempt, costing U.S. retailers an average of $17.20 per failed order)
- Re-delivery costs, customer service burden, and damaged SLA performance
The Hidden Cost of Pricing Models
Businesses using per-API-call pricing for route optimization face a cost driver teams rarely track as a routing cost. As fleet size grows and teams run optimization more frequently — for re-routing, resequencing, batch planning runs — API call volume compounds. The cost of running optimization at all inflates, which often causes teams to ration optimization calls rather than run them as needed.
The tool meant to reduce costs starts generating its own cost pressure at scale.
Cost-Reduction Strategies for Transportation Routes
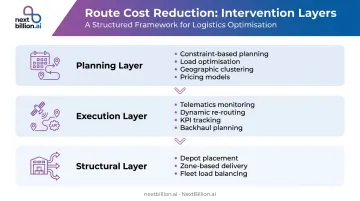
Transportation route costs originate at three distinct layers: how routes are planned, how they're executed, and the structural environment they operate within. Each layer has different failure modes — and different fixes. The strategies below address all three.
Strategies That Reduce Costs by Changing Routing Decisions
These are planning-layer interventions — decisions made before a vehicle moves.
Use constraint-based route planning instead of shortest-path logic. Standard navigation minimizes distance. Real delivery routes involve time windows, vehicle weight limits, truck-restricted roads, driver hours of service, and customer priorities.
Planning without these constraints produces routes that look optimal on paper but fail on-road — generating re-routing mid-trip, missed delivery windows, and overtime. NextBillion.ai supports 50+ hard and soft constraints, including vehicle dimensions, hazmat rules, multi-compartment configurations, and skills-based assignment, so routes are executable, not just theoretically short.
Right-size loads before finalizing routes. Load planning and route planning are often treated as separate processes — load the truck, then route it. Optimizing both together ensures vehicle capacity is maximized per trip, reducing the number of trips needed to cover the same delivery volume. NextBillion.ai handles multi-dimensional capacity planning (weight, volume, quantity) directly within the route optimization engine.
Batch deliveries by geographic proximity, not order of receipt. First-in-first-out routing creates illogical stop sequences — a driver might visit the north side of a city, cross to the south, then return north. Geographic clustering before sequencing eliminates cross-territory travel. NextBillion.ai's Clustering API groups locations into proximity-based clusters before optimization runs, with configurable constraints for depot boundaries and territory design.
Choose routing software with predictable pricing models. As optimization query volume scales, per-API-call pricing becomes a cost driver in itself. NextBillion.ai offers per-vehicle and per-order pricing models specifically to prevent this — fixed monthly costs that absorb fluctuations in call volume, so teams optimize as frequently as needed without managing a per-call budget.
Planning-layer fixes eliminate structural waste before routes run. But costs also accumulate during execution — through deviations, delays, and missed optimization windows. That's where the next layer of interventions applies.
Strategies That Reduce Costs by Changing How Routes Are Managed
These are execution-layer interventions — what happens while routes are actively running.
Monitor route adherence using telematics integration. When fleet management data from systems like Samsara, Geotab, or Motive feeds directly into the routing platform, dispatchers can detect deviations as they happen.
NextBillion.ai integrates with all three, enabling one-click dispatch to driver apps and live tracking to one-meter accuracy. Real-time deviation alerts allow intervention before small deviations become overtime or missed stops.
Trigger dynamic re-routing based on live conditions. A route planned at 6 a.m. can be invalidated by a 9 a.m. accident. Systems capable of live re-routing — based on real-time traffic, road closures, and new high-priority orders — prevent the delay cascades that inflate overtime and miss SLAs. NextBillion.ai's dynamic optimization recalculates routes continuously throughout the day — the same approach UPS applies across ORION's 66,000+ daily routes.
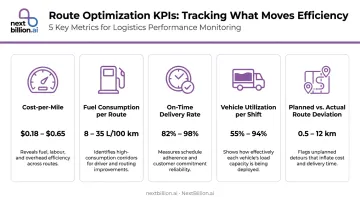
Track per-route cost KPIs systematically. Without consistent measurement, optimization is guesswork. Key metrics to track:
- Cost-per-mile and cost-per-stop
- Fuel consumption per route
- On-time delivery rate
- Vehicle utilization per shift
- Planned vs. actual route deviation
These reveal which routes chronically underperform and where intervention will generate the highest return.
Reduce empty return miles by planning backhauls. The return leg of a delivery route is often run empty — at full operating cost. NextBillion.ai's backhaul planning capability identifies return load opportunities in real time, clustering pickups, transfers, or secondary deliveries onto return routes. Given ATRI's 16.7% empty-mile benchmark, even partial improvement here generates meaningful per-mile cost reduction.
Execution improvements extract more from existing routes. But some inefficiencies are structural — built into territory design, depot placement, or how workload is distributed across the fleet. Those require a different kind of intervention.
Strategies That Reduce Costs by Changing the Context Around Routes
These are structural interventions — addressing the conditions that determine how hard or easy it is to run efficient routes.
Reassess depot locations relative to delivery density. If vehicles consistently travel long distances before reaching their first stop, the problem may be where the fleet originates. Territory design and depot placement decisions can reduce average first-mile and last-mile distances systemically across all routes — not just one at a time.
Implement zone-based delivery grouping by day or shift. Rather than routing across an entire service area daily, assigning routes to defined zones by day reduces cross-territory overlap, shortens average route length, and makes load consolidation easier. Zone discipline also creates route predictability — drivers, dispatchers, and customers all benefit from consistent patterns. NextBillion.ai's zone routing tools support geofenced territory assignment with dynamic adjustment for demand fluctuations.
Build fleet-wide load balancing across vehicles and shifts. When optimization runs at the network level rather than per vehicle, it distributes stop volume across available assets — preventing some vehicles from running at capacity while others run underloaded.
NextBillion.ai's network-level optimization accounts for vehicle capacity, workload equity across drivers, and multi-hub assignments simultaneously, extracting more from existing assets before adding new vehicles.
Conclusion
Sustained transportation cost reduction starts with identifying where cost actually originates — in the planning layer, the execution layer, or the structural environment — and applying the right intervention at each layer.
The compounding effect runs in both directions. Unoptimized routes compound cost over time. Optimized routes, maintained with regular audits and live monitoring, compound savings. The difference between a one-time improvement and sustained cost reduction is whether route optimization becomes an active operational discipline — one that's regularly reviewed, adjusted to real-world conditions, and supported by tooling that can handle the complexity of live logistics. That's where platforms like NextBillion.ai's route optimization API earn their place: not as set-and-forget software, but as infrastructure for ongoing decision-making.
Frequently Asked Questions
How do you optimize transportation routes?
Start by analyzing current delivery data to identify stop sequencing gaps and underloaded vehicles. Apply constraint-based planning logic — time windows, vehicle capacity, road restrictions, driver hours — using route optimization software. Then monitor per-route KPIs consistently to identify underperforming routes and close the gaps driving excess cost.
What are the 3 C's of transportation planning?
The 3 C's are Cost, Capacity, and Customer Service. Route optimization directly influences all three: it reduces per-mile and per-stop costs, maximizes vehicle capacity utilization per trip, and improves on-time delivery rates that determine service quality.
What is the biggest hidden cost in transportation routing?
Suboptimal stop sequencing and vehicle underutilization. Neither triggers an alert, but both compound silently across every route every day — adding miles, wasting capacity, and inflating fuel and labor costs without ever appearing as an identifiable "routing failure."
How much can route optimization reduce transportation costs?
Results vary by fleet size and baseline inefficiency. UPS's ORION system saves roughly 100 million miles and 10 million gallons of fuel annually — projected at $300–$400 million per year. At a smaller scale, Xpress Global Systems achieved a 35% reduction in operating costs and 13% fewer miles driven per month after deploying NextBillion.ai's route optimization.
What factors should route optimization software account for?
At minimum: traffic conditions, delivery time windows, vehicle load capacity, driver hours of service, and truck-specific road restrictions (weight limits, height clearances, hazmat rules). More sophisticated platforms handle 50+ constraints simultaneously — producing routes that are genuinely executable in the field, not just theoretically optimal.
How does AI improve transportation route optimization?
AI enables predictive routing by learning from historical traffic patterns, driver completion times, and actual route performance — instead of applying uniform assumptions across every stop. It also enables dynamic re-routing in real time and scales constraint-handling to levels that rule-based algorithms can't manage efficiently across large fleets.