The Origin-Destination (OD) Matrix is the analytical framework that solves this. Understanding how it works, what it stores, and how to apply it can meaningfully improve routing decisions, fleet utilization, and transportation planning at any scale.
With U.S. business logistics costs reaching $2.3 trillion — equal to 8.7% of GDP — and trucking running at $2.26 per mile in 2024, there's little margin for decisions based on guesswork or proximity estimates.
Key Takeaways
- An OD Matrix stores travel cost (time, distance, or monetary cost) between every origin-destination pair in a network
- Values reflect actual road network travel — not straight-line estimates, which understate real distances by ~30%
- OD matrices power route optimization, fleet dispatch, facility location decisions, and transit planning
- The "cost" metric should match your business objective — delivery time, fuel spend, or a composite impedance
- Scalability matters most — enterprise ops need tools that handle thousands of OD pairs without per-call pricing surprises
What Is an Origin-Destination Matrix?
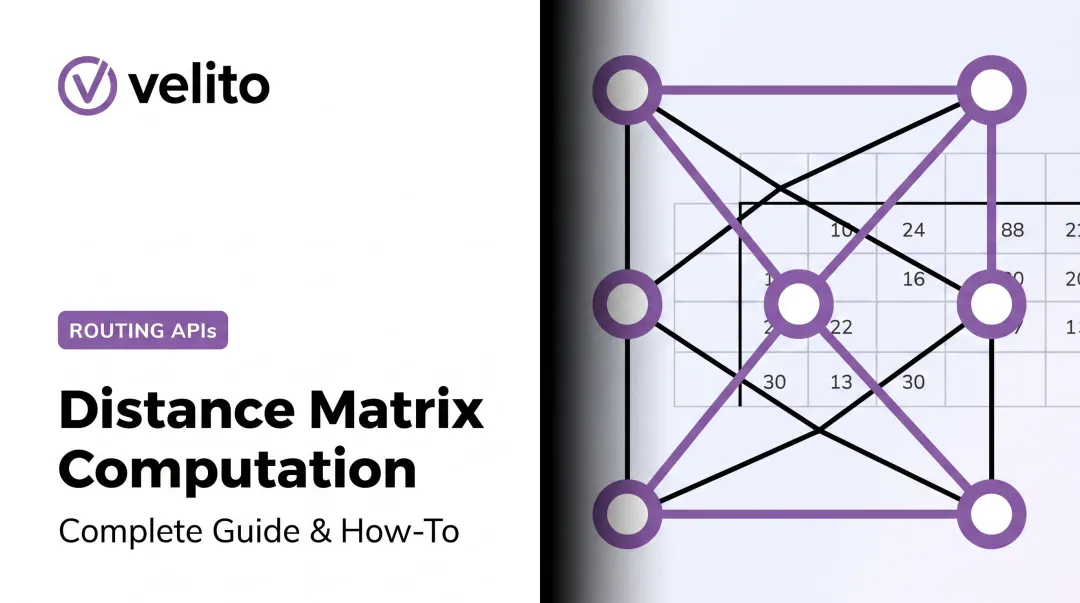
An OD Matrix is a structured table where:
- Rows represent origin locations
- Columns represent destination locations
- Each cell stores the measured travel cost between that specific pair along a real transport network
The key word is network-based. Cell values follow actual roads, speed limits, turn restrictions, and one-way streets — not straight-line geometry. A straight-line estimate looks clean on paper but routinely understates real-world travel cost, which creates serious errors downstream in route planning and depot placement decisions.
What Is an OD Pair?
An OD pair is the directional connection between one specific origin and one specific destination — the atomic unit of any OD matrix. Warehouse 3 → Delivery Zone 12 is one OD pair. Zone 12 → Warehouse 3 is a separate OD pair, often with a different cost.
In a matrix with M origins and N destinations, there are M × N possible OD pairs. For 100 warehouses × 1,000 delivery zones, that's 100,000 pairs. Computing them accurately and quickly is where tooling quality becomes the deciding factor.
What Is an OD Cost Matrix?
The term "OD matrix" describes the structural concept — a table of origin-destination relationships. An OD cost matrix is the actionable version: it stores the calculated travel cost for each pair, computed along the actual road network.
Cost can be defined as:
- Travel time (minutes)
- Distance (miles or kilometers)
- Fuel expenditure
- Toll cost
- A composite impedance combining multiple factors
The right cost metric depends on your objective. Minimizing delivery time and minimizing fuel spend will produce different matrices — and different operational decisions.
Beyond cost metric choice, the matrix structure itself matters. OD matrices can be symmetric (A→B equals B→A) or asymmetric (one-way roads, turn restrictions, or directional traffic make A→B differ from B→A). Real-world logistics almost always demands asymmetric analysis.
Why OD Matrix Analysis Matters in Logistics
Without OD matrix computation, assigning vehicles and planning routes at scale requires either guesswork or brute-force iteration. Both produce suboptimal results. The operational costs are measurable: excess fuel, late deliveries, driver overtime, and poor territory assignments that compound daily.
OD matrix analysis addresses each of these failure points directly:
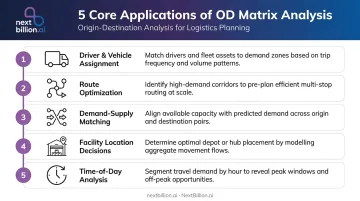
- Driver and vehicle assignment — assigns vehicles to zones based on actual travel costs, not proximity guesses
- Route optimization — provides the cost backbone that VRP solvers rely on; without an accurate matrix, route output is inaccurate or infeasible
- Demand-supply matching — quantifies real-world accessibility for ride-sharing, NEMT, and on-demand delivery platforms
- Facility location decisions — identifies the warehouse or depot location that minimizes aggregate travel cost to all demand zones
- Time-of-day analysis — recalculates costs using live or historical traffic data, improving accuracy for time-sensitive operations
UPS's ORION route optimization system offers a well-documented illustration of what accurate cost-matrix-backed routing delivers: an average reduction of 6–8 miles per driver per route, with projected annual savings of 100 million miles and 10 million gallons of fuel across the U.S. fleet.
Those gains are only possible when the underlying cost data is accurate. That's what OD matrix computation provides — and why the quality of the matrix directly determines the quality of every planning decision built on top of it.
How an OD Matrix Works: Step by Step
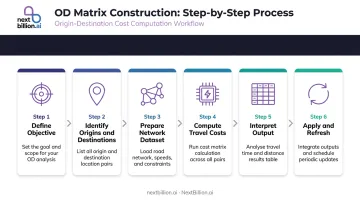
Building a usable OD matrix involves six stages. Skipping or rushing any one of them produces inaccurate values that compound into bad decisions.
Step 1 — Define the Objective
Specify the business question the matrix should answer. Daily driver dispatch, depot placement analysis, and transit network redesign each call for different cost metrics, time windows, and pair counts. Define this first. It determines everything that follows.
Step 2 — Identify Origins and Destinations
Gather and validate geographic coordinates for all origin and destination points. Common mistakes include:
- Using raw address strings instead of geocoded coordinates
- Including duplicate or erroneous points that inflate computation time
- Failing to verify coordinates visually on a map before running the matrix
A single miscoded coordinate produces an outlier cost value that can misrepresent an entire zone's viability. Get the coordinates right before anything else.
Step 3 — Select and Prepare the Network Dataset
The road network must include realistic attributes:
- Speed limits and road classifications
- Turn restrictions
- Vehicle-type restrictions (truck-prohibited roads, weight-limited bridges)
The quality of this dataset determines the accuracy of every cell in the matrix. A generic car-routing network will produce wrong results for a commercial truck fleet.
Step 4 — Compute Travel Costs
This is where the matrix computation engine calculates the least-cost path for every OD pair. For large matrices (thousands of pairs) this step requires either significant processing power or a scalable external API.
Tools with hard limits (a 25×25 cap, for example) cannot support enterprise-scale operations. A 100-vehicle fleet serving 500 stops generates far more pairs than those tools can handle in a single call.
Step 5 — Interpret the Output
Read the resulting matrix: each cell value represents the best achievable travel cost along the network for that pair. When interpreting:
- Flag outliers — unusually high values may indicate network errors or geocoding problems
- Apply cutoff filters to exclude impractical pairs (for example, zone-warehouse combinations beyond 90 minutes) before passing results downstream
Step 6 — Apply Results and Refresh
Feed the matrix into downstream systems: a route optimizer, dispatch algorithm, transit model, or facility location analysis. Network conditions change — traffic patterns shift, roads close — so plan to review and refresh the matrix as those conditions evolve. Stale values produce stale decisions.
OD Matrix in Action: A Real-World Walkthrough
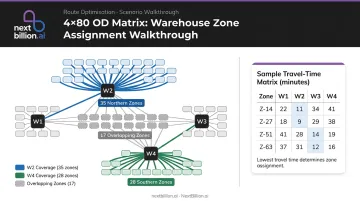
Scenario: A regional food and beverage distributor operates 4 warehouses serving 80 retail drop-off zones. Management needs to know which warehouse should serve which zones, and in what sequence drivers should run routes to minimize total fleet travel time.
Step 1 — Define the objective: Minimize total fleet travel time, using travel time in minutes as the cost metric, with a 90-minute cutoff to exclude operationally impractical zone-warehouse pairs.
Step 2 — Build input data: Geocode all 4 warehouse addresses and 80 zone centroids. Validate coordinates against a known map. Three zones have incorrect geocodes — correct them before running the matrix.
Step 3 — Compute the matrix: Run the OD cost matrix API call: 4 origins × 80 destinations = 320 OD pairs. Output: a 4×80 table of travel-time values in minutes, factoring in one-way streets, speed limits, and peak-hour traffic.
Step 4 — Interpret and apply:
- Warehouse 2 has the lowest average travel time to 35 northern zones
- Warehouse 4 serves 28 southern zones most efficiently
- 17 zones fall within range of multiple warehouses — assign each to the lower-cost option
- Feed the matrix into the route optimizer to sequence daily stops
Step 5 — Review and iterate: Two weeks in, re-run the matrix with updated traffic data. Morning peak congestion has made 6 zone-warehouse assignments suboptimal. Adjust accordingly.
Most teams treat Step 5 as optional. It isn't. Traffic patterns shift, new zones open, and assignments that made sense in March may cost you an hour a day by June. Refreshing the matrix regularly keeps those decisions grounded in current conditions.
Key Applications of OD Matrix Analysis
Last-Mile Delivery and Fleet Dispatch
OD cost matrices are the computational backbone of VRP solvers. Without an accurate matrix of travel times between every depot and delivery stop, route optimization produces inaccurate or infeasible routes. High-volume operations — hundreds of stops, dozens of vehicles — need matrices computed quickly with low API latency.
U.S. parcel volume reached 22.37 billion shipments in 2024, and UPS alone handles 20.8 million packages per business day, with drivers averaging 125 stops each. At that scale, even small inaccuracies in the cost matrix compound across thousands of routes daily.
Ride-Sharing and On-Demand Mobility
Platforms like ride-hailing services use OD matrices in real time to match drivers to riders — computing travel time from each nearby driver to the pickup point. NEMT and paratransit schedulers use them to batch trips efficiently while meeting time-window constraints. GOIN, a paratransit operator handling approximately 2,000 trips per day, used a large-scale distance matrix API to achieve 95% ETA accuracy using real-time traffic and historical patterns.
Facility and Depot Location Optimization
Businesses use OD matrices to answer the "where should we open our next warehouse?" question by computing aggregate travel cost from candidate locations to all demand zones. The candidate with the lowest total cost across its assigned zones is the optimal choice. A city logistics terminal study using a Green p-median model applied this approach, analyzing 4 candidate locations against 43 service users to identify the optimal placement.
Urban Transportation and Transit Planning
City planners and traffic engineers use OD matrices to understand origin-destination flow patterns — identifying high-demand corridors, modeling congestion, and allocating infrastructure investment. FHWA's NextGen NHTS OD analysis, for example, segments travel demand across 583 U.S. geographic zones to guide highway investment decisions. Transit agencies apply the same logic to align service routes with where people actually travel — cutting unnecessary transfers and closing coverage gaps.
How NextBillion.ai's Distance Matrix API Addresses Scale Limitations
The biggest bottleneck in OD matrix computation for enterprise logistics isn't the concept — it's the tooling. Legacy APIs cap matrices at 25×25 pairs, charge per API call at rates that make large matrices cost-prohibitive, and lack the truck-specific routing attributes that commercial fleets actually require.
NextBillion.ai's Distance Matrix API removes these barriers directly:
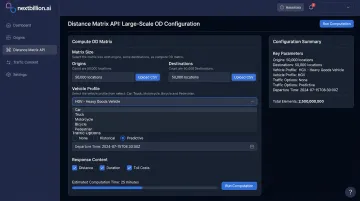
- Matrix size: Supports up to 5,000 × 5,000 origins and destinations in a single API call — up to 25 million OD pairs simultaneously
- Truck-specific routing: Accounts for vehicle height, weight, axle load, length, hazmat classifications, and bridge restrictions — not car-routing assumptions applied to freight
- Asymmetric OD pairs: Handles one-way streets, turn restrictions, and directional traffic, so A→B and B→A costs reflect actual road network behavior
- Traffic integration: Both real-time and historical traffic data inform travel time calculations; the Flexible API supports departure-time-based calculations for time-of-day analysis
- Custom map editing: Operations teams can inject road closures, speed limit overrides, no-entry zones, and vehicle-class restrictions directly into matrix calculations via the Road Editor App
That scale only matters if it stays affordable. NextBillion.ai's per-vehicle and per-order pricing means running a large OD matrix doesn't trigger a surprise bill. Teams can iterate, refresh with updated traffic data, and run scenario analyses without cost anxiety — unlike pay-per-call models that scale exponentially as order volumes grow.
Because NextBillion.ai's route optimization engine runs on the same platform as the Distance Matrix API, businesses move directly from OD matrix computation to multi-stop route generation. No data reformatting, no separate tools — just 50+ hard and soft constraints applied in one system: time windows, vehicle capacity, driver shifts, priority stops, HOS compliance.
Hawx Pest Control captured this plainly: "By substantially reducing the number of developer hours spent on scheduling, NextBillion.ai's Route Optimization API and large Distance Matrix API have helped us improve our operational efficiency and increase our cost savings significantly."
For operations teams running hundreds of routes daily, that end-to-end flow — from matrix computation to optimized dispatch — is where the real efficiency gains compound.
Frequently Asked Questions
What is an origin-destination matrix?
An OD matrix is a table that stores travel cost (time, distance, or another metric) between every origin-destination pair in a network. Rows represent origins, columns represent destinations, and each cell holds the cost of travel along the actual transport network between that pair.
What is origin-destination analysis?
OD analysis is the process of studying travel patterns between origins and destinations. It covers computing travel costs, analyzing flow volumes, and deriving insights that support decisions in logistics, transportation planning, urban mobility, and infrastructure design.
What is an OD pair?
An OD pair is the directional link between one specific origin and one specific destination. This is the fundamental unit of any OD matrix. In real-world networks, the cost of A→B often differs from B→A due to one-way roads, turn restrictions, and directional traffic patterns.
What is an OD cost matrix?
An OD cost matrix is a specific type of OD matrix where each cell contains a calculated travel cost computed along an actual road or transport network. That cost can represent time, distance, fuel consumption, or a composite impedance value — not a straight-line estimate.
How is an OD matrix used in route optimization?
Route optimization algorithms (VRP solvers) rely on an OD cost matrix as their primary input. The matrix supplies travel time or distance between every stop pair. The optimizer uses that data to determine the stop sequence and vehicle assignments that minimize total cost across the fleet.
What is the difference between an OD matrix and a distance matrix?
The terms are often used interchangeably. Technically, a distance matrix stores point-to-point distances, while an OD matrix can hold any travel cost metric and is more broadly associated with transportation planning. For routing applications, a network-based OD cost matrix and a distance matrix serve the same computational role.