Introduction
Delivery zone mapping is the process of defining exactly where each driver operates, based on road networks and demand density rather than guesswork. Most delivery failures aren't caused by bad drivers — they're caused by bad zone design. When boundaries are drawn too large, drivers overextend. When zones ignore road networks and demand density, routes that look clean on paper collapse under real conditions. A delivery zone map defines exactly where each driver operates, and that single decision shapes everything downstream: delivery windows, workload balance, and cost per stop. Getting this right matters because last-mile delivery accounts for 30-35% of total delivery cost, making zone design one of the highest-leverage decisions in a logistics operation.
The stakes are real. Last-mile delivery accounts for 30–35% of total delivery cost, according to Deloitte — making zone design one of the highest-leverage decisions in your logistics operation. And McKinsey's 2024 research found that roughly 10% of U.S. deliveries require redelivery due to coordination failures alone.
That cost exposure is fixable — but only if you build zones the right way from the start. This guide walks through zone types, the data you need before drawing a single boundary, a five-step creation process, and the mistakes that sink otherwise well-designed operations.
Key Takeaways
- A delivery zone map defines where each driver operates — its design directly affects delivery speed, cost, and customer satisfaction
- Zone types include radius circles, custom polygons, ZIP code boundaries, and travel-time isochrones
- Before drawing anything, gather historical order data, depot locations, fleet capacity, and service-level commitments
- Optimize zones around four variables: order density, travel time vs. distance, driver-to-zone ratio, and overlap policy
- Zone failures trace back to gut-feel drawing, ignoring road network barriers, and static designs that never adapt to demand shifts
Types of Delivery Zone Approaches: Which Method Fits Your Operation?
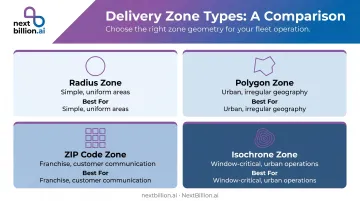
There's no universally correct zone shape. The right approach depends on your business model, geography, and what your tools can support. Four methods cover most real-world operations.
Radius-Based Zones
A circular zone drawn outward from a depot at a fixed distance — say, 5 or 10 miles. Quick to set up and easy to communicate internally.
Best for: Single-depot operations in areas with uniform road networks.
One limitation: radius zones ignore actual road infrastructure. A 5-mile circle that looks clean on a map can include areas separated by a river with no nearby crossing. For simple, low-volume local operations, radius zones work fine. For anything more complex, they create hidden operational problems.
Polygon Zones
Custom shapes drawn by hand or generated algorithmically, following actual street networks, neighborhood boundaries, or natural geographic features.
Best for: Urban operations where irregular geography makes circles impractical.
Polygon zones offer the most operational precision. The tradeoff is setup time — you need map knowledge and either a GIS tool or a platform with polygon drawing capabilities. Once drawn correctly, polygon zones tend to stay accurate longer than other methods because they reflect real geography rather than mathematical abstractions.
ZIP Code or Administrative Boundary Zones
Zones built by grouping existing ZIP codes or district boundaries. Easy to explain to customers ("we deliver to ZIP codes 10001–10010") and straightforward to manage in franchise or multi-city models.
Best for: Franchise operations, regional coverage maps, customer-facing service area communication.
ZIP code boundaries weren't designed for logistics. Some ZIP codes are oddly shaped, non-contiguous, or cross natural barriers. Always validate ZIP-based zones against your actual road network before treating them as production-ready.
Isochrone (Travel-Time) Zones
Zones defined by how far a driver can travel in X minutes from a depot, rather than raw distance. As Esri documents, isochrones (or service areas) are polygons calculated against real street networks and can incorporate traffic data, travel direction, and vehicle type.
Best for: Operations where delivery window predictability matters, particularly in urban markets with variable traffic.
This is the most operationally accurate method. A 30-minute isochrone from your depot tells you exactly where a driver can realistically reach, factoring in congestion, turn restrictions, and road type — not just straight-line distance.
NextBillion.ai's Isochrone API generates these travel-time polygons from any depot point. You can set time intervals, specify vehicle mode (car, truck, or two-wheeler), and export results as GeoJSON for import into your routing platform.
What You Need Before Creating Your Delivery Zone Map
Preparation determines zone accuracy. Zones drawn without the right data look correct on a map and fail in practice.
Operational and Demand Data
Before drawing any boundary, map where your orders actually come from:
- Historical delivery addresses — imported into a GIS tool or mapping platform and visualized by volume
- Peak demand windows — which days, hours, and weeks drive the highest order concentration
- Average order frequency by area — identifies where zone boundaries should tighten or expand
- Known service problem areas — zones that consistently generate late deliveries or redelivery attempts
This demand heatmap becomes the foundation for every boundary decision you make.
Depot and Fleet Information
Demand data tells you where orders go — fleet data tells you how far you can realistically reach. Zone size is physically constrained by what your vehicles can cover in a shift. You need:
- Confirmed depot and warehouse locations (including any secondary hubs)
- Fleet size per depot and vehicle types available
- Average vehicle capacity (weight, volume, or order count)
- Driver shift hours and break requirements
For multi-depot operations, confirming each facility's coverage area before drawing zones prevents overlap, gaps, and uneven driver workloads across locations.
Mapping Tools and File Format Readiness
Match your tool to your complexity level:
| Use Case | Recommended Tool |
|---|---|
| Simple, one-time zone creation | Google Maps, Google Earth |
| GIS-level polygon editing or ZIP file prep | QGIS, Mapshaper |
| Multi-zone operations with driver assignment | Dedicated route planning platform |
| Programmatic zone management at scale | Geospatial routing API (such as NextBillion.ai) |
For file formats: KML and GeoJSON are the two standards you'll encounter most. KML is an OGC-recognized XML format for geographic visualization; GeoJSON (defined by IETF RFC 7946) supports Polygon and MultiPolygon geometry types and is the preferred format for API-based integrations. If you're integrating zones into a routing API, default to GeoJSON — it's more universally supported in programmatic workflows.
How to Create a Delivery Zone Map: Step by Step
The workflow below applies across most tools and platforms. Specific actions vary depending on whether you're using a manual tool, a no-code app, or a routing API.
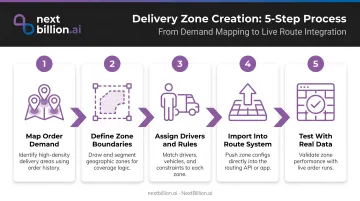
Step 1: Map Your Order Demand Across Your Coverage Area
Plot historical delivery addresses on a map — either manually in Google Maps or by importing a CSV into QGIS or a similar GIS tool. You're looking for:
- High-density order clusters
- Under-served or outlying areas
- Geographic extremes (addresses furthest from your depot)
- Natural demand boundaries like neighborhoods, rivers, or highways
This heatmap view tells you where zone lines should fall. Skip it, and you're drawing zones by assumption.
Step 2: Define Zone Boundaries Using Your Chosen Method
Select your zone type based on operation type and tool capability, then draw:
- Polygon zones: Trace boundaries using your demand heatmap to keep high-density clusters together. Most platforms include a polygon drawing mode.
- ZIP code zones: Filter and dissolve the relevant ZIP boundary files using Mapshaper (
-filterand-dissolvecommands) or QGIS, then import as KML. - Isochrones: Configure travel time from each depot using your routing tool or API, then adjust time thresholds until zone coverage matches driver capacity.
Critical check: each zone must contain a manageable stop count for one driver in one shift. If a single zone requires more stops than your driver can complete, split it before moving forward.
Step 3: Assign Drivers, Depots, and Operational Rules to Each Zone
Link each zone to a specific driver or driver pool, a starting depot, and a vehicle type. Then configure zone-specific rules:
- Time windows — specific delivery hours the driver must hit within that zone
- Vehicle restrictions — weight limits, road access rules, or size constraints that determine which vehicles can enter
- Skills requirements — certifications or handling qualifications needed for cold-chain, medical, or hazmat loads
- Blocked hours or days — scheduled blackouts for zones near schools, event venues, or restricted-access corridors
NextBillion.ai's Route Optimization API supports all of these as constraints at the job, vehicle, and depot level — including multi-dimensional capacity (weight, volume, pallets), shift limits, and required breaks.
Step 4: Import or Finalize Your Zone in Your Route Planning System
If you drew zones in an external tool, export as KML or GeoJSON and import into your routing or dispatch platform. Verify the imported shape matches your intended boundary before saving.
For API-driven operations at scale — managing multiple depots, frequent zone updates, or automated driver assignment — define zone polygons programmatically and validate that stop-to-zone assignment logic works correctly before going live.
NextBillion.ai's Geofencing API supports custom polygon and shape definition, letting businesses allocate defined areas to specific delivery agents or stores and automate zone-aware dispatch.
Step 5: Test the Zone With Real or Sample Order Data
Run a test batch of orders through your zone configuration and verify:
- Stops are assigned to the correct zones
- No stops fall through the cracks at zone boundaries
- Routes generated within each zone are realistic (drive time, stop count, sequence)
- Driver capacity isn't consistently exceeded or under-utilized
NextBillion.ai's platform includes a sandbox environment for testing route optimization configurations before going live, plus A/B testing capabilities to compare zone configurations. Identify edge cases — stops near boundaries, overlapping coverage areas, consistently overloaded zones — and adjust before rolling out.
Key Parameters That Determine Delivery Zone Effectiveness
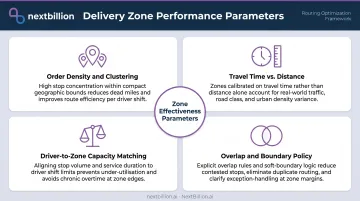
Zone quality shows up in operational outcomes: on-time rates, cost per delivery, and driver utilization. Four parameters control most of that performance — and getting any one of them wrong creates compounding inefficiencies across the rest.
Order Density and Geographic Clustering
Zones should keep high-volume stops geographically clustered. When stops are scattered across a zone, drivers backtrack — increasing drive time per stop and fuel cost per delivery.
NextBillion.ai's Clustering API addresses this directly: it groups large volumes of delivery stops into proximity-based clusters before route optimization runs, balancing geographic proximity against maximum cluster size, depot boundaries, and priority weighting. For zone planning, this means you can use clustering output to inform where boundaries should fall.
Travel Time vs. Distance Radius
A 5-mile zone in a dense urban grid is practically very different from a 5-mile zone in a suburban area. Raw distance ignores traffic, congestion, and road network structure — all of which the International Transport Forum (ITF) identifies as major constraints on urban freight operations.
Travel-time zones (isochrones) produce more predictable delivery windows because they're calculated against real road conditions, not straight-line distance. For customer-facing SLA commitments, this difference is material.
Driver-to-Zone Ratio and Capacity Matching
Each zone must be sized to match the capacity of its assigned driver. A zone with 80 daily stops assigned to a single driver on a 6-hour shift isn't a planning stretch — it's an impossibility.
When it fails, it shows up as late deliveries. Rarely does anyone trace it back to a zone design problem.
The number of zones should scale with your driver headcount. Review zone boundaries whenever fleet size changes. NextBillion.ai's Route Optimization API supports hard capacity constraints (weight, volume, max tasks per vehicle) and shift limits, ensuring that optimization doesn't generate routes that physically can't be completed.
Zone Overlap and Boundary Buffer Policy
Hard zone cutoffs are simple but create disputes about who handles stops near boundaries. Small overlap buffers — sometimes called "grey areas" — allow either driver to handle boundary stops based on current workload.
Overlapping zones improve flexibility, but they require explicit dispatching rules. Without them:
- The same stop gets assigned to two drivers simultaneously
- Drivers skip boundary stops assuming the other will cover them
- Disputes slow down dispatch and delay SLA resolution
Define your overlap policy before you go live, not after your first duplicate delivery.
Common Mistakes When Creating Delivery Zone Maps
Most zone failures aren't technical. They come from planning shortcuts that don't reflect how operations actually work.
Drawing Zones by Intuition Rather Than Demand Data
The most common mistake: using gut feel or simple geometric shapes without first mapping where orders actually originate. This produces zones that are undersized where demand is highest and oversized where it's lowest.
Map historical order data before drawing a single boundary. Your demand heatmap is the only valid starting point.
Ignoring Geographic and Infrastructure Barriers
Rivers, highways, railroad crossings, and one-way streets create invisible walls. A zone that looks compact on a map can require a 20-minute detour if it crosses a restricted bridge or a divided highway with no U-turn.
Always validate zone boundaries against actual road network data — not just satellite imagery. Esri's distinction between straight-line distance buffers and street-network service areas captures exactly this problem: a buffer polygon and an isochrone for the same location can look dramatically different once road constraints are applied.
Setting Zones Once and Never Revisiting Them
Delivery zones degrade over time. A zone optimized for 30 daily stops becomes a bottleneck when stop count grows to 60. Customer base expansion, driver headcount changes, and seasonal demand shifts all affect whether existing zone boundaries still make sense.
Build a regular review cadence into your delivery zone management process — at minimum after any major operational change (new depot, significant headcount change, new service area).
Overlooking Cross-Zone Spillover and Unrouted Stops
Zones with hard geographic cutoffs often leave stops near boundaries unrouted or double-assigned. Test every zone configuration with real order data before going live.
You also need a clear policy for stops that fall outside all defined zones. "Assign to nearest zone driver" and "flag for dispatcher review" both work — pick one before you go live, not after your first missed delivery.
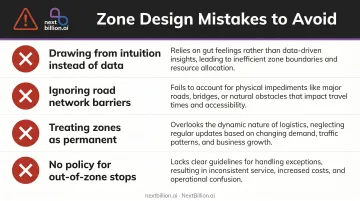
Four mistakes to avoid in every zone configuration:
- Drawing boundaries from intuition instead of historical order heatmaps
- Ignoring road network constraints that inflate real-world travel time
- Treating initial zone designs as permanent rather than revisiting them regularly
- Launching without a defined policy for out-of-zone and boundary-adjacent stops
Frequently Asked Questions
Can I use AI to create delivery zone maps?
Yes. AI-powered tools can analyze historical order data, road networks, and driver capacity to suggest or auto-generate zone boundaries. NextBillion.ai's Clustering API uses these inputs to create proximity-based zone recommendations — practical for multi-depot operations or complex demand patterns where manual drawing becomes impractical.
What is the best tool for creating a delivery zone map?
The right tool depends on your operational scale. Google Maps and QGIS work for simple or one-time zone creation. For businesses managing multiple zones, frequent updates, or automated driver assignment, a dedicated route planning platform or geospatial API handles the operational logic that manual tools can't. These platforms also recalculate zones as order density shifts, letting dispatchers adjust boundaries without redrawing shapes by hand, and connect zone data directly to routing and driver-assignment workflows instead of leaving it as a static reference map.
How do I decide where to draw delivery zone boundaries?
Boundaries should follow demand density clusters, natural geographic barriers, and driver capacity limits — avoid drawing arbitrary shapes. Map historical order locations first, then draw boundaries that keep high-volume clusters together and each zone's stop count manageable per driver per shift.
How many delivery zones should my business have?
Match your zone count to your driver count and operational structure — typically one zone per driver or one zone per vehicle route per day. Too many zones increases management complexity; too few creates oversized zones that consistently generate late deliveries. Review the count seasonally: order volume shifts, new hires, and added vehicles change the math, so a zone plan built for one quarter's demand can become inaccurate within a few months if left unchecked.
Can delivery zones overlap?
Yes, intentionally. Overlap buffers near boundaries give dispatchers flexibility to assign boundary stops to whichever driver has capacity. Overlapping zones do require explicit dispatching rules, though, to prevent the same stop from being assigned to two drivers.
What file format is used to import delivery zones into route planning software?
KML and GeoJSON are the most widely supported formats. KML works well for zones drawn in Google Earth or Maps; GeoJSON is preferred for API-based integrations. Many platforms also accept KMZ files, which are compressed KML and can be converted before import. Before importing, check that boundary coordinates are valid polygons without self-intersections, since malformed shapes are a common cause of failed imports or zones that render incorrectly on the map.
What is the best app to create a delivery route?
For a handful of stops, Google Maps or Apple Maps can sequence a route manually. Once you're routing multiple drivers, managing time windows, or factoring in vehicle capacity, a dedicated route planning tool or API is a better fit — it can optimize stop order automatically and adjust routes as new orders come in, which manual map apps cannot do at scale.
How to create a zone in Google Maps?
In Google My Maps, add a new layer, then use the drawing tool to trace a polygon around the area you want as a zone, following streets or natural boundaries. You can label the shape, save it, and export it as a KML file. This works for a small number of static zones but requires manual redrawing whenever boundaries need to change.