Table of Contents
Map nerd or not, nearly everyone has seen at least one Covid-19 map in the last two years. The world was glued to maps to track the virus spread across the world — where the outbreak is in control, where cases are still spreading, which direction it is migrating and other such information.
The type of maps that the world was/is looking at are called ‘Thematic Maps’.
It became the most popular visual medium to view live updates. Contracts Lead at MapTiler Luis Suter shared during our webinar that several of the Covid case tracking thematic maps hosted on their platform went viral. And they had to scale up their infrastructure as they received billions of requests from mapmakers in just a couple of hours.
What are thematic maps?
As the name suggests and the above-mentioned example illustrates, thematic maps help mapmakers and data analysts represent a specific theme tied to a specific geographic area or physical space. Be it tracking election results’ trends, supply chain demands, employment rates, air traffic movement, or natural disasters, these maps extract all relevant geospatial data related to a theme and project it on the map. This enables end-users to understand the connection between the selected theme and the geographic locations it is placed against.
Why do we need thematic maps?
From the same data information, we can visualize 1000s of different thematic maps by choosing to transcribe and evaluate only a few element(s) per map.
This is primarily why businesses and industries need thematic maps.
It converts any non-visual information about a particular subject into an easy visual form. It focuses on the selected theme and features only those reference points that are needed to communicate the purpose of the map and theme effectively. The rest of the reference points and attributes that you’d usually find on traditional maps are eliminated.
Thematic maps enable people to trace and spot geographical patterns and trends residing under the datasets.
Who uses thematic maps?
Industries using spatial analysis and the ones that benefit from pattern recognition leverage these maps. Here’s a non-exhaustive list of industries and businesses that use thematic mapping:
- Logistics & Transportation
- Supply Chain Management
- Urban Planning
- Delivery Services
- Banking
- Financial Services
- Automotive
- Retail & Services Sector
- E-commerce
- Insurance
- Health Services
- Energy & Environment
- Life Sciences
- Archaeology
How can businesses use thematic maps?
When used in conjunction with Location APIs like Route Optimization API, Tracking API, Geofencing API, and Clustering API, thematic maps can greatly benefit businesses, particularly those involved in logistics, ride-hailing, delivery services, and field operations. Here’s how it works:
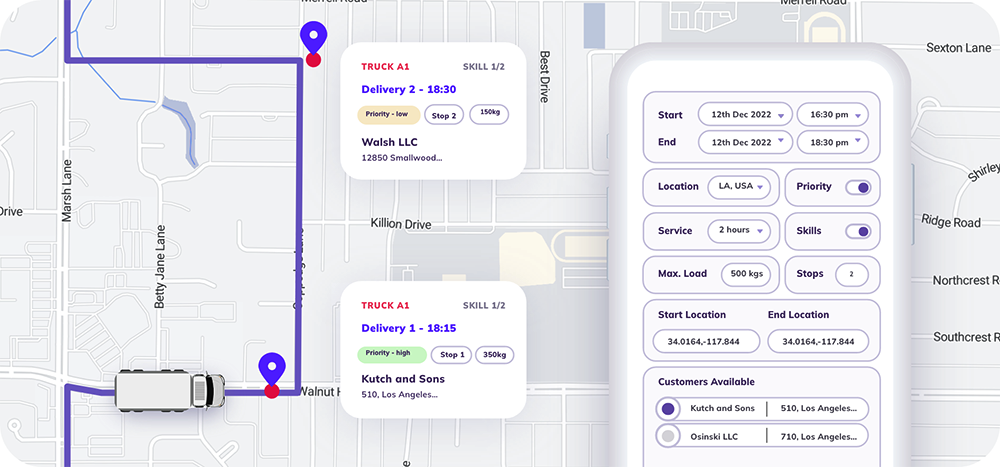
- Optimized Route Planning: The Route Optimization API can assist in optimizing delivery or service routes based on distance, traffic conditions, time windows, vehicle capacities, and customer preferences. To visualize these optimized routes, use thematic maps, which display key data points such as starting points, destinations, waypoints, and route segments.
- Enhanced Decision Making: Thematic maps can include additional data layers like customer locations, service areas, traffic patterns, and demographic information. Businesses can make informed decisions about resource allocation, customer targeting, and expansion strategies by visualizing this data in conjunction with optimized routes.
- Real-Time Monitoring: By combining real-time tracking capabilities with the Live Tracking API and thematic maps, businesses can track the status of vehicles and field personnel in real time. This allows for proactive route adjustments in response to changing conditions like traffic congestion, accidents, or new customer requests.
- Targeted Marketing Campaigns: Businesses can identify high-potential target areas by clustering customer data according to demographics, purchasing behavior, or other relevant factors. Geofencing API can then be used to draw virtual boundaries around these clusters on thematic maps. This enables businesses to launch targeted marketing campaigns, promotions, and events based on specific geographic areas, thereby increasing marketing effectiveness and driving sales.
- Retail Site Selection: Thematic maps can show clustering analysis results and other data layers like population density, foot traffic patterns, competitor locations, and socioeconomic indicators. Businesses can use this data to determine the best locations for new retail outlets, restaurants, and service centers. Geofencing API can help define proposed site boundaries and assess their potential customer reach and market penetration.
- Logistics and Fleet Management: The Clustering API allows you to group delivery or service requests by proximity, frequency, or other criteria. These clusters can be visualized using thematic maps showing existing delivery routes, warehouse locations, and transportation networks. Businesses can optimize route planning, allocate resources efficiently, and monitor fleets by creating virtual perimeters around delivery zones or service areas with the help of Geofencing API.
- Urban Planning and Development: Clustering analysis, combined with geofencing technology, can help urban planners and developers identify areas for infrastructure investment, community revitalization, or mixed-use developments. Thematic maps can show clustering patterns, land use classifications, zoning regulations, and environmental factors, allowing stakeholders to make more informed decisions about land use, transportation networks, and public facilities.
- Safety and Security: Geofencing API can be used to define virtual perimeters around high-risk or sensitive areas, such as construction sites, industrial facilities, or restricted zones. These geofenced areas can be visualized using thematic maps, including relevant safety information, emergency response protocols, and evacuation routes. Businesses can use this technology to improve workplace safety, protect assets, and reduce risks.
Integrating location APIs with thematic maps provides businesses with valuable tools for strategic decision-making, targeted marketing, operational efficiency, and risk management, all leading to increased profitability and market competitiveness.
Explore how NextBillion.ai’s APIs and SDKs with thematic maps can enhance your business operations and drive growth. Book a demo today to explore the possibilities.
Where are thematic maps used?
Use cases of thematic maps differ from industry to industry. Within the industries listed above, these maps are used by several internal disciplines, including operations, product development and marketing.
We have listed some of the most common business use cases across diverse functional areas:
- Decide where to develop infrastructure to support services — e.g., areas that need charging infrastructure for EVs or ATM infrastructure for banking self-services.
- Conduct supply-demand analysis — e.g., study mismatch in demand (orders, booked rides) and supply (riders, cab drivers) to bridge the gap and reduce idle time.
- Assist profitability analysis — e.g., identify suburbs where carpool on-demand service is performing well, identify locations with higher loan default rates, right areas to acquire new users.
- Identify areas to run geomarketing campaigns — e.g., view the countries/states/towns where electric scooters are legal to run e-scooter rental services’ ad campaigns, measure conversion rates of your marketing activities in each geography.
- Analyze product and project risk — e.g., identify areas prone to calamities like landslides to gauge what should be insurance coverage rates.
- Geofence product/service’s reach — e.g., define delivery areas and serviceable pincodes in remote areas.
- Find the origin of a problem — e.g., flag accident-prone freeways/roads, discover areas with high customer drop-offs, study ride cancellation reasons in different areas.
- Analyze usage patterns — e.g., determine which of the areas are using which of your on-demand services (grocery delivery, food delivery, package delivery) the most.
- Keep track of the market changes/fluctuations — e.g., verify if the drop in footfalls/orders is due to the rise of competitors in certain areas, analyze if a store is located in the wrong community.
Types of thematic maps
1. Choropleth maps
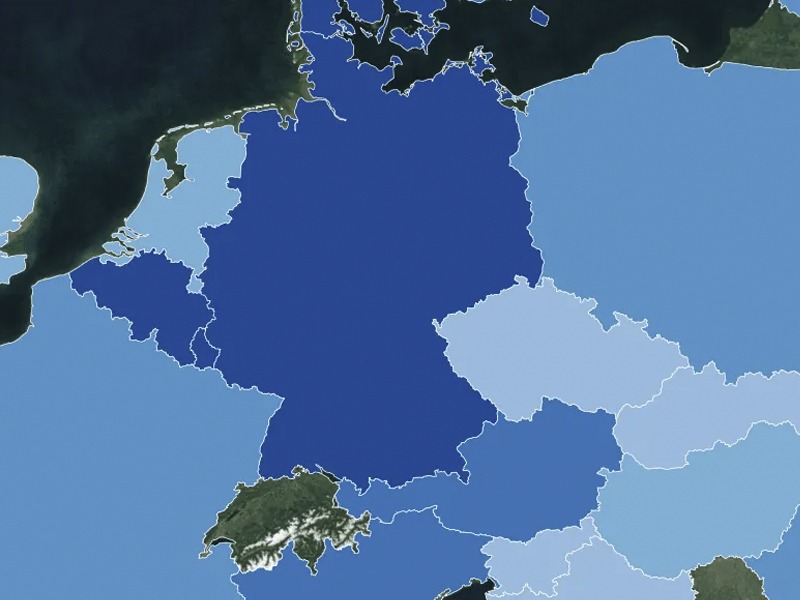
Image source: MapTiler
These are the most widely used and popular thematic maps. Shades, colors and patterns are utilized to depict the distribution of statistical data (like quantity, density, percent, value) on a map to display the differences across geographies.
It helps to identify the regional boundaries of your data, the way the map above has clearly defined, which in turn reveals unique insights. Because of their versatility and wide application, these smart maps have become an integral part of businesses’ geospatial analytics today.
For example, it can be used to highlight the safest districts for e-scooters to encourage sustainable transport. Or to monitor urban networks and infrastructures while working on smart city projects.
Major corporations rely on choropleth maps to plan their CSR strategies. They identify target areas with low access to basic resources and introduce new economical businesses/products as part of their social responsibility. Inventory and logistics management are other two popular use cases of choropleth thematic maps across sectors.
Merit: Easy to prepare and understand, especially in the case of normalized/standardized data that displays rates like percentages
Demerit: It can lead to incorrect assumptions by misrepresenting the impact of larger areas compared to smaller areas.
2. Heat maps
Image source: Locale.ai
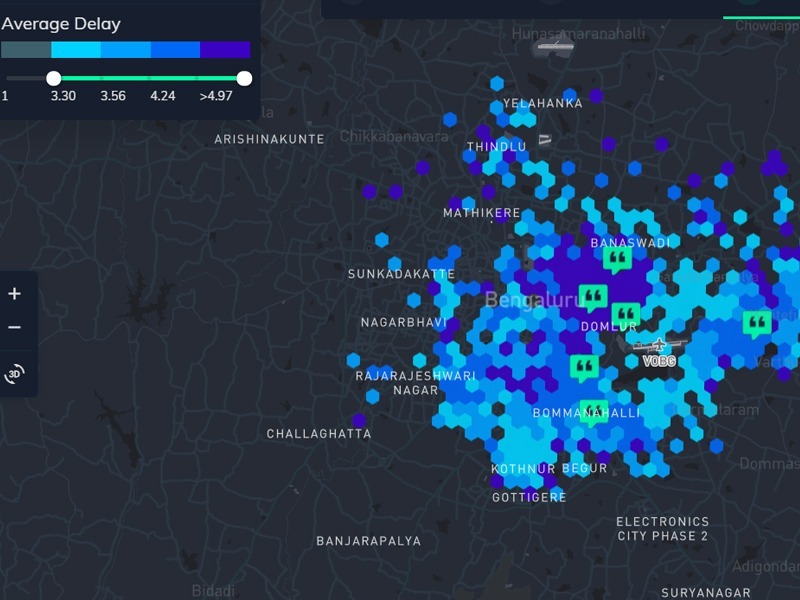
With an effective metaphorical name, heat maps, also known as isopleth maps, display the intensity of elements. It helps to visualize data by using variations in colors in direct correlation with the magnitude of an event/situation. The most recent example of a viral heat map is the one that projected the record temperatures’ rise at the Arctic and Antarctic poles.
In the business world, heat maps help to summarize patterns and trends without being tied to geographical boundaries. For instance, the hex heat map above has been split into five colored sections to project the average delay time. The darker the color gets, the average delay time increases.
Maps like these enable companies to analyze the performance of their service and spot the gaps through granular spatial information. Questions like what’s causing delays, on what days of the week/month the delays are longer, which areas are the most affected and many more can be answered via heat maps.
Merit: It is a great analytical tool, especially for hyperlocal companies, to get a quick overview of factors affecting the bottom line.
Demerit: It can be misused because color transitions might influence perceptions of readers that are not a true interpretation of the data.
3. Dot density maps
Image source: Locale.ai
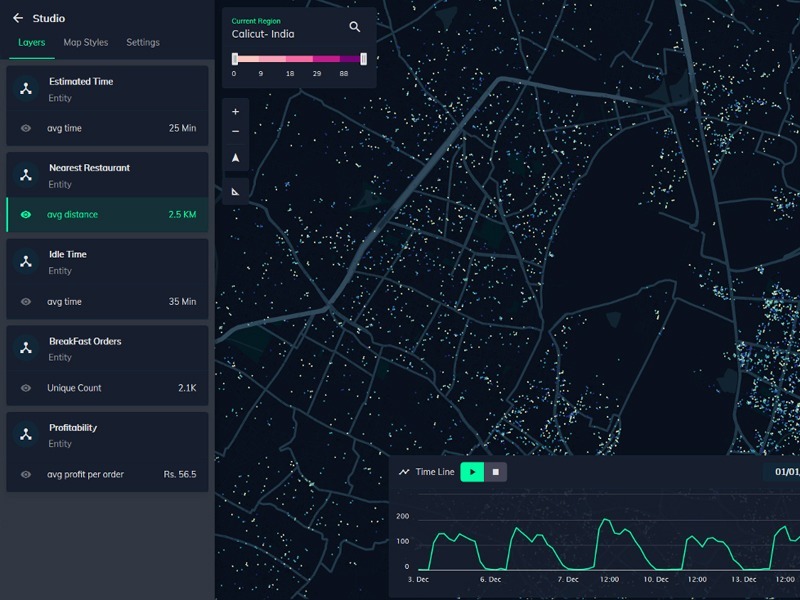
Dot density maps use a large number of points, dots or polygons to show the density of the numeric values on a map. The higher the dots in an area, the higher the concentration of the selected value. Similarly, fewer dots represent lower concentration. It is important to note that a dot might represent a single data point or a set of data that has an attribute in common.
For example, The dot density map above is made for map readers from the supply and operations teams of an on-demand company. It will help them analyze on-ground operations and analyze shifts in user behavior patterns and trends.
Merit: Excellent thematic map to exhibit density distributions.
Demerit: It is difficult to gauge the dots’ exact values.
4. Graduated and proportional symbol maps
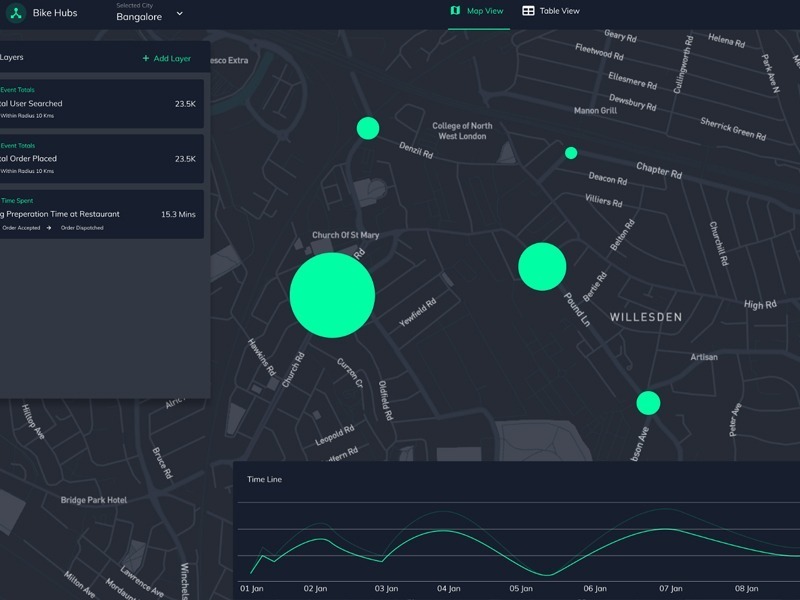
Image source: Locale.ai
In a dot density map, the size of the dot remains the same irrespective of the value. The dots in graduated and proportional symbol maps change in size as per the numeric value of the element they represent, as shown in the image. The size of the symbols varies in ascending order of the data value to reflect the quantitative difference.
Merit: Work best when users want to display data findings that have a lot of variation and range.
Demerit: Larger symbols might conceal smaller ones leading to misinterpretation.
5. 3D extrusion maps
Image source: Locale.ai
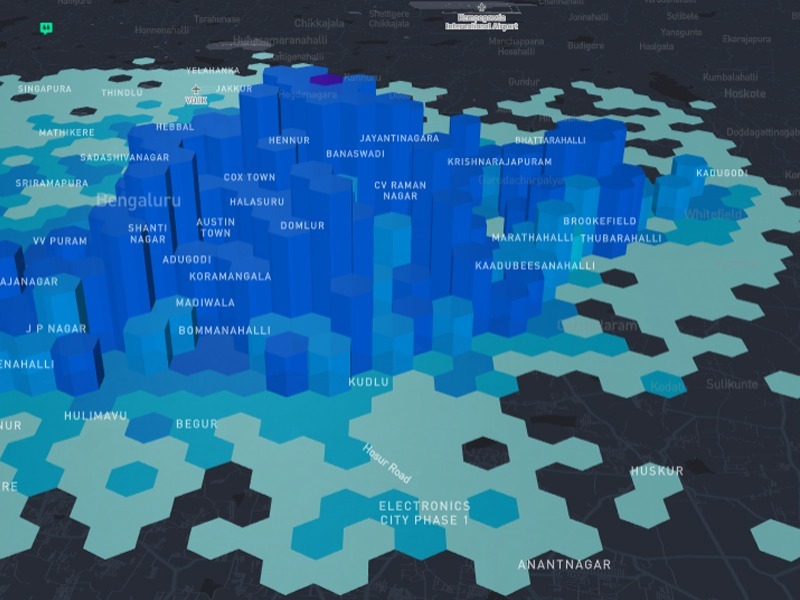
These thematic maps bring static maps alive. They improve the visibility of data by adding a layer of 3D extrusions of objects/elements like buildings, elevations, traffic movement or information blocks that may get lost in static maps.
The map above illustrates 3D buildings arranged as per their height value. It offers more than a bird’s-eye view and hence makes it easy to recognize spatial objects.
Merit: This works best if readers must understand/easily visualize the depth and scale of the information a map is trying to convey.
Demerit: Readers might find it difficult to read where 3D is not critical or where when 2D maps can convey the information (like the distance between two points) in a simpler and faster manner.
6. Cartograms
Image source: Organic Agriculture by Paull Hennig – CC BY-SA 4.0
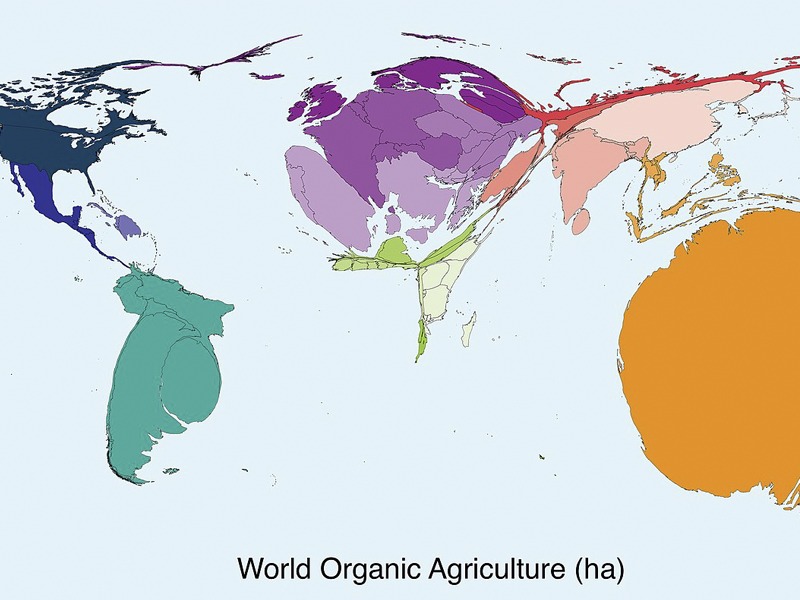
Cartograms offer a fresh perspective when it comes to distributing and visualizing geographical data on a map. With these thematic maps, users can resize the geographical size of the countries/areas according to the density of their focal point.
For instance, in the resized density-equalizing cartogram world map above, you can see countries represented as per the density of certified organic agriculture hectares. Australia — the smallest continent — appears bigger than Asia — the largest continent, as the former accounts for 51% of the world total. This type of visualization helps to understand the global organic food market growth. This is a great insight to fuel market expansion decisions and plan logistics capabilities of organic grocery delivery or organic food startups.
Merit: It enables readers to visualize abstract concepts quite easily.
Demerit: It essentially distorts the visual representation of geography.
Conclusion
Academic cartographer and geographer Kenneth Field wrote in his book ‘Thematic Mapping: 101 Inspiring Ways to Visualise Empirical Data’, “Each map creates a unique visual lens into the data. It brings elements into focus and makes others recede. Each map is as accurate as the next, but they all manipulate the data and the graphical sign language in multifarious ways.”
Data on a spreadsheet or graphs might not reveal important insights when performing spatial data analysis. With thematic maps, businesses and industries can confirm a hypothesis, identify patterns, display trends, back business-critical decisions and monitor progress.
Ready to get started?
Request a DemoTable of Contents


