
Route Optimization API
Optimize routing, task allocation and dispatch
Distance Matrix API
Calculate accurate ETAs, distances and directions
Directions API
Compute routes between two locations
Navigation API & SDK
Turn by Turn Instructions for Drivers & Technicians
Route Optimization Software
Plan optimized routes with 50+ Constraints
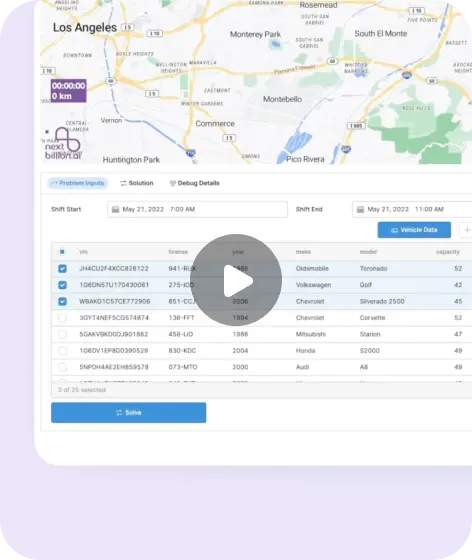
Product Demos
See NextBillion.ai APIs & SDKs In action
AI Route Optimization
Learns from Your Fleet’s Past Performance
Platform Overview
Learn about how Nextbillion.ai's platform is designed
Road Editor App
Private Routing Preferences For Custom Routing
On-Premise Deployments
Take Full Control of Your Maps and Routing
About Us
Our story, vision
and mission
Contact Us
Reach out to us for any product- or media-related queries
Write to us at

Table of Contents
For most logistics startups and local couriers, the first “north star” of delivery is Google Maps. It has a familiar interface, plus it offers world-class traffic data; thus, it becomes the default tool to navigate from point A to point B. But as you scale from a 1-stop job to a multi-stop job, that shift from simple navigation to complex orchestration uncovers an important technical ceiling. Google Maps was never built for commercial logistics; it was built for consumers.
Google Maps cannot handle the complex high-volume logistics needs of last-mile delivery because it treats routing as a simple point-to-point problem rather than a vehicle routing problem with time windows (VRPTW). Limitations include capped stop limits, no multi-stop optimization, no dynamic re-routing capabilities, and the inability to consider operational constraints such as delivery windows, vehicle restrictions, or manage fleets at scale. To be profitable in high-volume last-mile delivery, businesses must get off the map and onto a dedicated routing engine made for optimization rather than just directions.
In this article, we will look at why Google Maps fails for last-mile delivery and how to overcome these issues with various strategies.
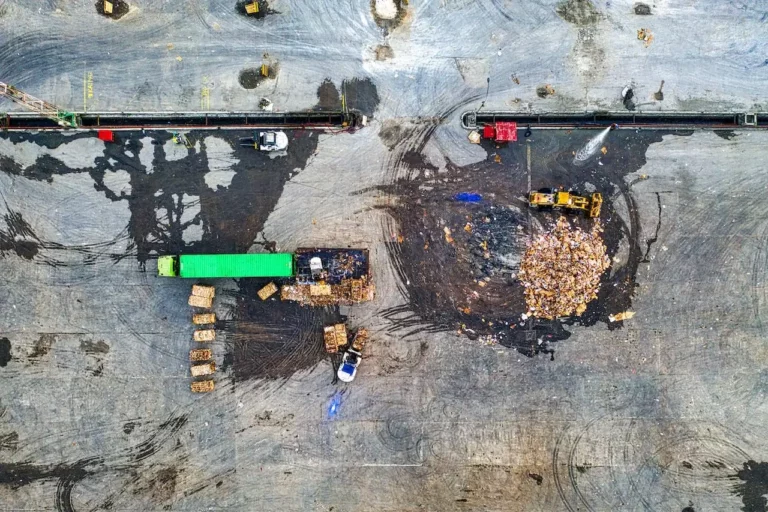
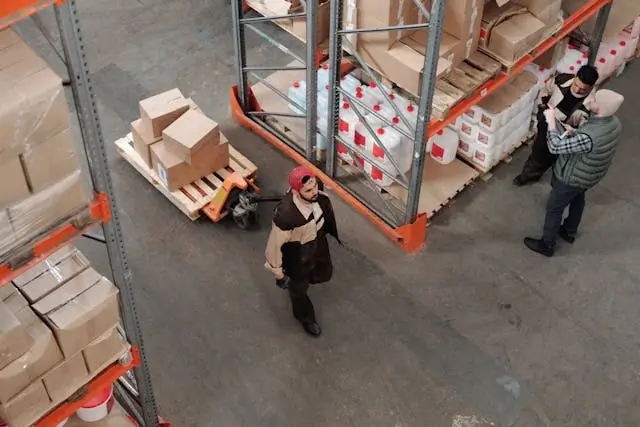
Last-mile delivery is when goods move from a distribution point, like a fulfillment center, regional warehouse, or micro-hub, to where the end customer is. These places can be homes, office buildings, retail stores, or pickup kiosks. It’s the final part of the journey for deliveries; here, the work becomes most visible and operationally complicated.
Last-mile delivery needs planners to think about specific constraints that are not usually present in mid-mile or bulk freight operations. Drivers face high-density stops with variable traffic conditions, gated communities, and restricted delivery hours. Orders vary by volume, service level, and type of location. In high-volume urban areas, one missed address or reroute request can hold up dozens of later stops, so efficient last-mile routing is crucial for success.
For retail networks, last-mile transportation may only involve just-in-time replenishment across stores, while in the D2C model, it means delivering thousands of orders per day to individual addresses with strict adherence to ETAs.
Google Maps has changed the game for the delivery business. It gives very precise navigation in real-time and many features that are just right for delivery drivers. A report from the Global Positioning System (GPS) market research company, Allied Market Research, says that the size of the market for GPS tracking devices is expected to reach $4.88 billion by 2028. The growth rate from 2021 to 2028 is 12.8%, which means it will grow significantly. This increase is mostly due to more people using GPS technology in the transportation and logistics sectors, with Google Maps being a major contributor.
This is what Google Maps provides for delivery drivers:
→ Delivery mode: A special setting designed specifically for delivery drivers that finds the best routes based on delivery needs, makes it easy to see customer details, and works with delivery management tools.
→ Real-time order tracking: Customers can see where their orders are on a map in real time; this cuts down on talking between drivers and customers and makes things clearer.
→ Contactless delivery: Drivers can say that orders are “delivered” right from the app, allowing contactless delivery and lowering the chances of COVID-19 spread.
→ Delivery-specific navigation: Google Maps now gives guides made just for delivery cars, considering things like car size, weight limits, and parking space.
→ Better voice commands: Drivers may use voice commands to access delivery-specific features, such as marking an order as “delivered” or calling a customer without taking their hands off the wheel.
Google Maps is a tool for navigation, not for optimizing. At scale, the following are the gaps that become operational “taxes”:
At the center of this failure lies a very old math problem – the one called the Traveling Salesperson Problem. It’s easy to describe: find the shortest route that goes through certain places and comes back home. It sounds simple, but it gets more complicated when you add more stops; this is known as Combinatorial Explosion.
In Google Maps, you have to put your stops in order yourself. When a driver or dispatcher tries to “guess” which order will be best for more than 20 deliveries, they run up against the limits of human thinking.
Since the human brain can’t compute quintillions of variables (like traffic patterns, left-turn delays, and one-way streets) at once, it results in “zigzagging” – crossing back into areas already traveled. This inefficiency usually adds an extra 20% to 40% in mileage and fuel compared to an auto-sequenced route using a dedicated TSP solver.
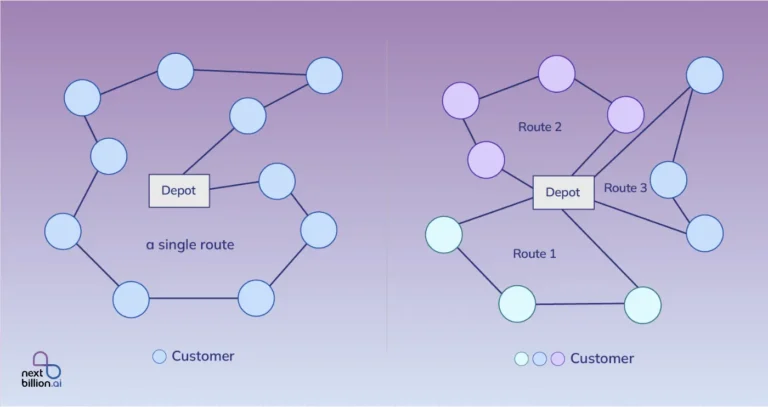
Google Maps is built for a single user looking for directions between two points. You are dealing with the Multi-Vehicle Assignment Problem in commercial logistics. If there are five hundred packages and ten drivers, Google cannot see the entire pool of work to be done in order to share it out. Without an automated assignment engine, dispatchers must draw zones on a map by hand, which often results in:
Overlapping territories: Two drivers passing each other on the same street.
Underutilized assets: One driver done in four hours while another has an eight-hour load and is overwhelmed.
Service failures: High-priority “Express” packages getting assigned to a driver already at max capacity on the other side of town.
Google Maps treats every vehicle as though it were a passenger car. In reality, delivery fleets comprise many different types of assets that have strict physical and legal limitations, which the Google algorithm does not consider:
Volumetric and weight capacity: Google does not know whether or not a van is physically full; it could suggest that a driver should take 50 stops when this particular vehicle can only fit 30 boxes inside its cargo area, resulting in re-loading trips that kill productivity.
Environmental requirements: Some orders require refrigeration (Cold Chain) or have HAZMAT restrictions; therefore, if Google Maps were to route a chemical truck through a restricted tunnel or “no idling” zone, then there would be heavy fines for the company plus spoiled cargo.
Vehicle-specific routing: Standard algorithms do not take into account bridge heights or weight-restricted residential roads, so what might be good advice for a sedan could lead to an accident with very serious consequences for heavy-duty box trucks.
Google Maps generally employs centroid geocoding, which places a pin at the geometric center of a property or the mailbox at the end of the street. This is effective with a suburban house, but a disaster with a large industrial warehouse or a multi-tower apartment complex.
A driver directed to a center-property pin will find himself staring at a perimeter fence or a closed pedestrian gate without realizing that the loading dock or service entrance is actually on an entirely different street on the other side of the building. This pin-to-door difference requires drivers to go around the block, which is unproductive in terms of mileage and time-wasting.
In high-density urban settings, it is just half the battle to get to the curb. To Google Maps, the destination is the completion of the trip, whereas to a delivery professional, the trip is complete when the vehicle is in the most legal and safe position.
The consumer-facing algorithm used by Google does not value commercial curbside information, including:
Specific loading areas: Understanding specifically where a van is allowed to idle in a free area without getting a ticket of 150 dollars.
Time-restricted parking: Eliminating No Standing Areas, which are modified on an hourly basis.
Always-access points: These are alleys or side streets that are actually devoted to freight.
In the absence of this information, drivers waste a typical 7 to 10 minutes per stop merely in search of a parking spot and then walking miles to the actual drop-off location. This “search time” can accumulate to more than six hours of wasted work in a day of 50 stops – the kind of loss that a conventional navigation tool is not designed to offset.
ETAs from Google Maps only include transit time; it does not include any Service Time Calculation, which is the time spent parking, going up a high-rise, or getting a signature (5 to 15 minutes). At 20+ stops, this “hidden” time adds up. A driver who is “on time” per Google’s navigation could actually be two hours late against their promised delivery window by mid-afternoon. This is what causes the “Waiting at the Window” effect.
Customers get a “10-minute” alert that turns into an hour, and then calls to customer service increase, plus it kills your brand. To keep trust with customers, you must close the gap between map data and them with Automated Comm (via SMS or Push notifications). But using Google Maps for this task at scale has a tech and cost challenge:
Although Google Maps is free to the casual user, scaling up a delivery fleet with logic accessible to consumers presents financial leakages. In the case when a business attempts to make a navigation app a logistics engine, the inefficiency tends to eat up the operational margins.
Fuel vs. Revenue – The Profitability Gap: The most direct effect of non-optimized routing is the Cost-Per-Stop. Since Google Maps does not solve the shortest path by default between 20 or more destinations, drivers tend to do backtracking. Ineffectively sequenced routes will generally incur 10-20% excess mileage compared to an optimally sequenced route. Suppose a van costs 0.60 per mile to run, and an additional 15 miles a day over 50 vans increases the unnecessary fuel and maintenance expenses in the fleet to 150,000 each year.
The API Billing Surprise: Developers rely on the Google Maps Platform APIs to create professional features (such as computing distances to an entire fleet). But unless there is advanced caching logic or batch-processing logic, costs can run out of proportion. Each time a route is recalculated or an address is geocoded, it invokes a fee. These micro-transactions of Distance Matrix or Places APIs at scale can result in astronomical monthly bills that can frequently surpass the price of a dedicated, all-inclusive logistics SaaS.
The Human Cost – Driver Churn and the Idling Crisis: In-car frustration is a major reason behind driver turnover, and it is among the most costly logistics problems. When the system provides drivers with routes that make no sense or fails to provide ETAs, drivers get demoralized and have to deal with angry clients. Google Maps does not provide information about commercial parking or loading areas. It causes drivers to go around blocks or spend time in double-parked spots. Not only does this waste fuel, but it also has a major impact on the carbon footprint of the business and the chance of parking fines.
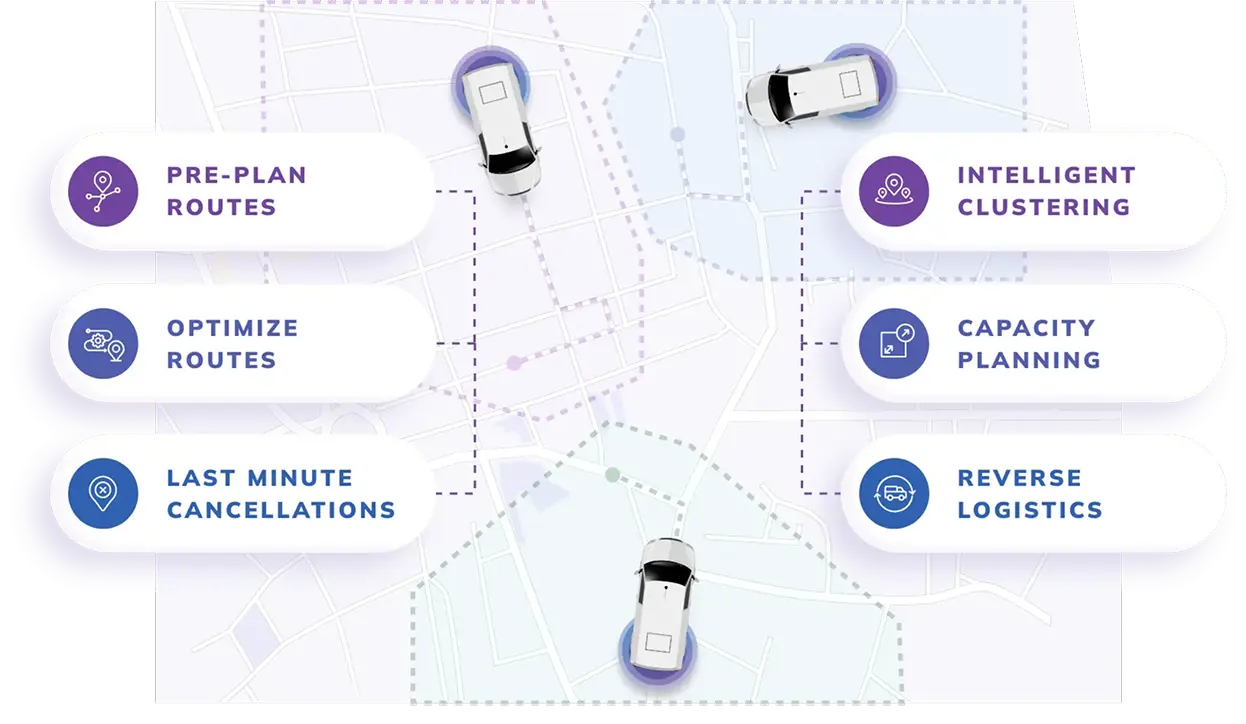
Companies planning to optimize their last-mile are investing in systems capable of responsively adapting to variability, scale over delivery models, and removing coordination gaps. The following six technology pillars that are transforming the management of the final leg by high-volume logistics teams are made possible with a location intelligence platform:
The most important change is to realize that routing (finding a path between two points) differs from optimization (finding the best sequence of an entire fleet). Whereas Google Maps can trace a driver between Stop A and Stop B, a specialized optimization platform looks at each stop plotted for each driver in real-time. It uses the optimum Master Plan to reduce total fuel, time, and the number of vehicles needed. This eliminates the frequent issue of overlapping, where two drivers in the same organization accidentally encroach on the same street.
Generic maps use the assumption of all users with a normal passenger car. The Vehicle-Centric Modeling is used in professional strategies and provides a digital profile of each asset within the fleet. This guarantees that the system only proposes roads that a particular vehicle can handle due to its height, weight, or hazardous material profile and eliminates expensive bridge strikes or fines imposed on illegal turns.
Moreover, rather than the nearest stop, different intelligence systems operate with Clustering and Zoning algorithms. Deliveries are clustered by neighborhood density, keeping the drivers in a small area (micro-zone). This removes the inefficiency of traversing the city in a crisscross, which enables a driver to make more stops per hour by remaining within a targeted geographic cluster.
Organizations are employing Predictive Intelligence to address the “ETA Gap”. These systems do not merely respond to live traffic, but instead analyze historical dwell times, the amount of time that a particular driver is truly present in a certain building, to refine arrival windows in the future. An example is that, when the data indicates that the delivery to a certain downtown high-rise always requires 15 minutes, the system automatically includes the buffer into the date of next Tuesday, 4:00 PM.
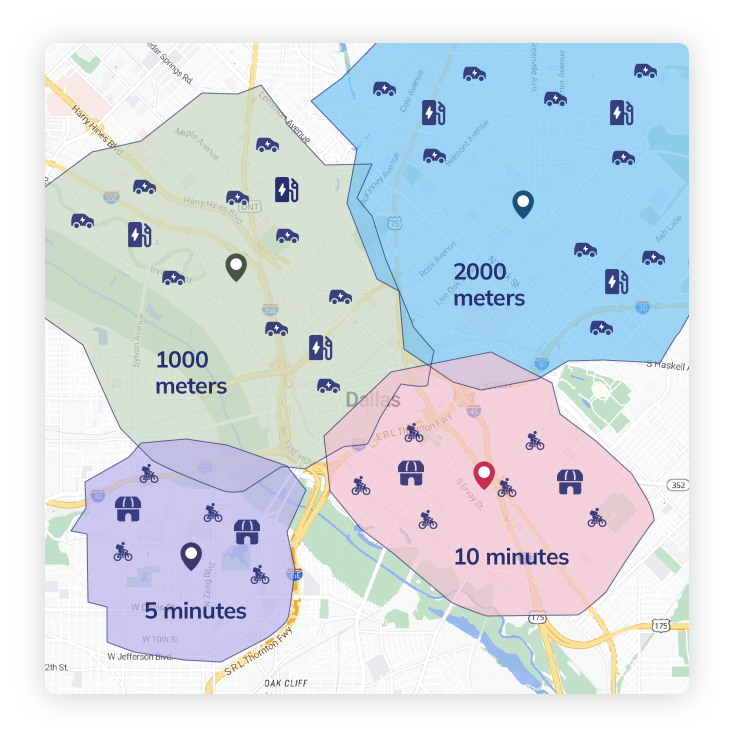
Businesses use Precise Geocoding and Geofencing to substitute vague street addresses to improve accuracy in communication. With precise Latitude/Longitude coordinates and a digital fence encircling a particular loading bay, the system sends out customer notifications only when the van is actually on-site. This will help the “Arrival” alert not to fire before the driver is actually in congested traffic on the main road next to the customer.
Last-mile delivery is the most inefficient component of the supply chain, accounting for 53% of total shipping costs. In meeting this challenge, businesses face several critical obstacles that must be overcome to deliver to customers’ doorsteps. The last-mile delivery solution from NextBillion.ai provides your business with the best way to address these numerous challenges. Here’s how you can enhance your unit economics and gross margins with improved map data and AI: just follow these five steps.
Route optimization is a great way to help meet customers’ changing needs and demands. It is an active way to react to their different needs by giving each one several delivery time options, alternative paths, and real-time tracking. This individual approach fits with what customers want today and has brought about a time when the last-mile fits the customer instead of the other way around.
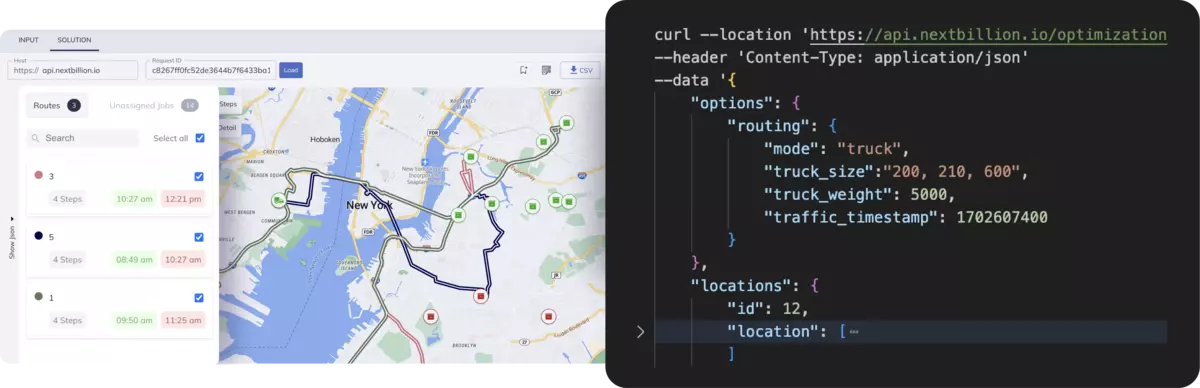
Route optimization is the link that brings together customer comfort, operational effectiveness, and business success in last-mile delivery, so you need to ensure that you are using the right tool for this job. NextBillion.ai’s Route Optimization API offers flexibility here as our API accepts many custom constraints from particular vehicle characteristics and types of goods being carried to delivery priorities and emissions regulations.
While Google Maps provides the world’s best street-level data for a car, NextBillion.ai is an enterprise-grade spatial intelligence engine designed to handle the complex variables of a professional fleet.
Feature | Google Maps | NextBillion.ai |
Primary Audience | Consumers & Small Business | Enterprise Logistics & Fleets |
Stop Limit | ~25 Stops | 10,000+ Stops |
Matrix Size (Scale) | 25 x 25: Limited origins/destinations per API call | 5,000 x 5,000: Built for massive, many-to-many delivery clusters |
Constraint Support | Limited: Basic time windows and traffic | 50+ (Time windows, capacity, skills) |
Accuracy | High for standard roads and traffic | Equivalent traffic data with custom “last-meter” edits |
Map Control/Customization | None (Static global map) | High (Road Editor, private maps) |
Optimization | Sequential | Algorithmic/Multi-vehicle VRP |
Geofencing | Basic | Advanced Custom Polygon geofencing |
API Billing Control | Rigid/Transactional | Caching & Batching to lower costs |
Customer Support | Self-service / Documentation | Dedicated Solution Engineers & 24/7 support |

Google Maps is among the most available navigational systems in small delivery operations. It is good when your volume and planning requirement is yet simple, and when the manual coordination does not slacken your workflow.
Google Maps can be trusted when your delivery company fulfills the following requirements:
In such instances, Google Maps offers a simple, inexpensive means of route planning and approximating ETAs. It is particularly handy in small retail stores, local bakeries or courier services with low deliveries.
Last-mile delivery is now determining both the cost efficiency and the consistency of delivery within high-volume logistics networks. The power of Google Maps to modify paths, reallocate orders, and ensure that SLA is handled is a strategic issue as order density rises and service regions grow.
Nextbillion.ai aids this transition with a platform that embraces the alignment of delivery planning and execution circumstances. Its AI models re-calculate routes based on real-time information of traffic, fleet status, and stop-level constraints. Dispatch allocation takes into consideration vehicle availability, geography, and the urgency of delivery, where every task will be based on the reality at the ground, rather than a fixed template.
This is why Nextbillion.ai’s routing solution is a potent facilitator of effective last-mile delivery, in which accuracy and flexibility have a direct influence on customer satisfaction. Get in touch with us for comprehensive assistance!
Google Maps can be integrated as a data layer for visualization or geocoding, but it does not function as a true optimization engine. Even when embedded into dispatch software, businesses must build custom algorithms to handle sequencing, allocation, and constraints, which increases engineering complexity and operational cost.
Manual planning works for small batches, but as delivery density increases, the number of possible route combinations grows exponentially. Dispatchers cannot realistically evaluate thousands or millions of permutations, which leads to suboptimal routing, longer delivery cycles, and inconsistent service levels.
Higher stop density requires systems to evaluate proximity, service time, and workload balancing simultaneously. Consumer navigation tools treat each stop independently, whereas logistics engines analyze the entire delivery network to prevent clustering errors, route overlap, or driver imbalance.
Historical data allows advanced routing systems to predict dwell times, identify recurring bottlenecks, and refine ETAs based on actual delivery behavior. Navigation apps lack this feedback loop, meaning they cannot learn from past operations to improve future planning.
Scalability is a major factor, but the real difference lies in decision intelligence. Navigation tools answer “How do I get there?” while optimization platforms answer “How should the entire fleet operate today?” This shift from direction-finding to operational planning defines enterprise-grade routing.
Bhavisha Bhatia is a Computer Science graduate with a passion for writing technical blogs that make complex technical concepts engaging and easy to understand. She is intrigued by the technological developments shaping the course of the world and the beautiful nature around us.