


Table of Contents
Traffic congestion can significantly impact logistics operations, leading to delays, increased fuel consumption, and higher operational costs. Overcoming these challenges requires more than just monitoring traffic conditions; it demands advanced route planning, real-time traffic data, and flexible routing solutions. Leveraging technologies like NextBillion.ai’s Directions and Matrix APIs can help logistics companies optimize their routes, minimize delays, and improve efficiency.
Here’s how:
Congestion in urban areas can slow down delivery times and reduce overall logistics efficiency. NextBillion.ai’s Distance Matrix API enables companies to analyze traffic flows within a city by estimating transit durations and distances between thousands of origin and destination points. The Matrix API can handle large datasets, processing up to 5000×5000 matrix size in a single request, which is invaluable for logistics companies managing high order volumes across multiple locations.
With real-time ETAs and distance calculations, logistics managers can reroute deliveries to avoid congested areas and ensure on-time arrivals. This capability allows companies to make data-driven decisions that improve route planning and fleet management, ultimately leading to faster deliveries.
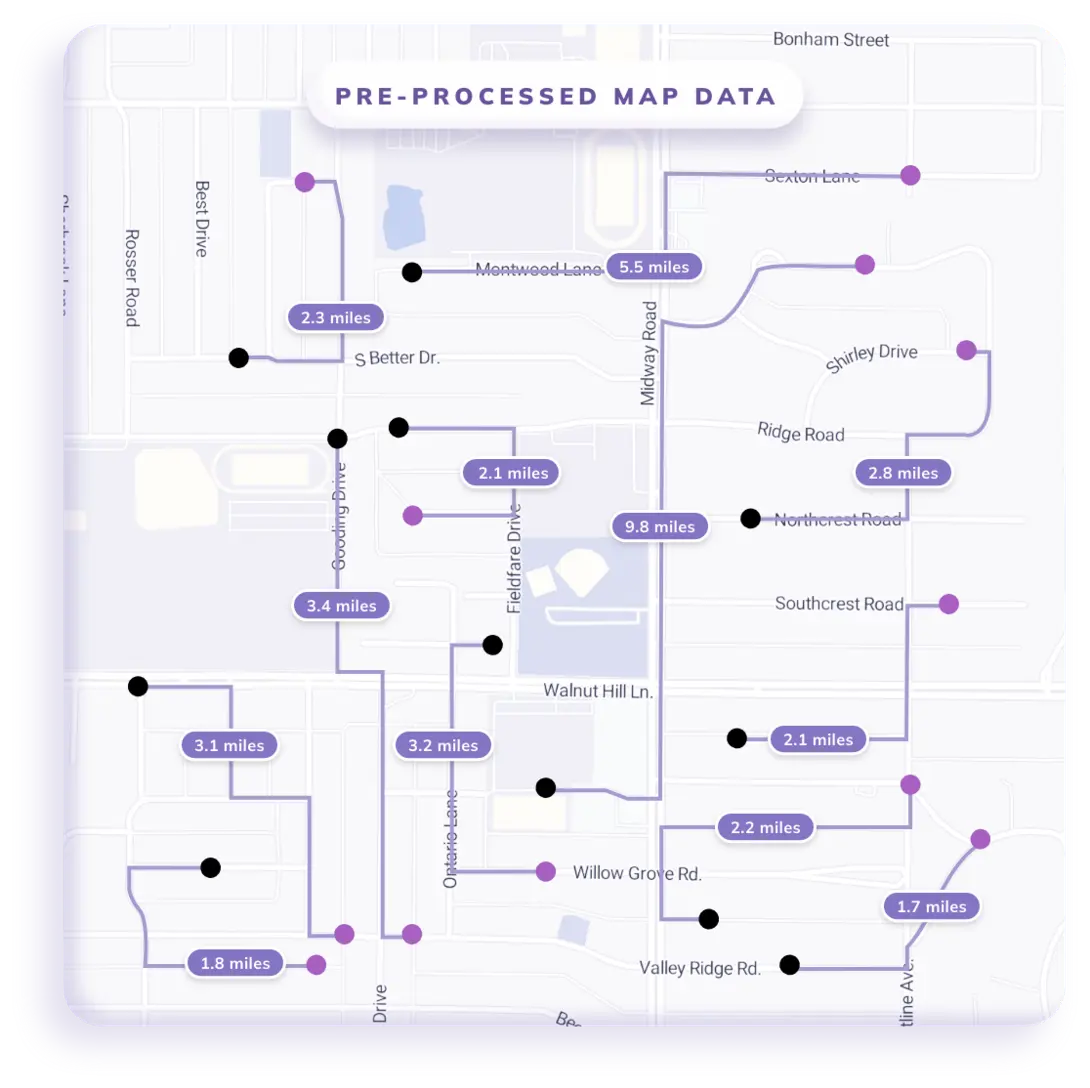
NextBillion.ai’s APIs use pre-processed map data, which provides faster transit estimates. By calculating distances and ETAs in just a few seconds, companies can quickly adapt their routes to changing traffic conditions. This is especially useful when handling time-sensitive deliveries in congested cities. Fast and accurate traffic data allows for dynamic rerouting, ensuring that deliveries are made on time even during peak traffic hours.
Logistics operations often involve a variety of vehicles, including trucks that have specific route requirements due to their size and weight. The Directions Flexible API allows logistics companies to plan routes with truck-specific parameters. By specifying vehicle dimensions and mode of transport, companies can avoid roads that are unsuitable for trucks or subject to vehicle restrictions. This feature ensures that trucks can navigate the city efficiently while adhering to local regulations.
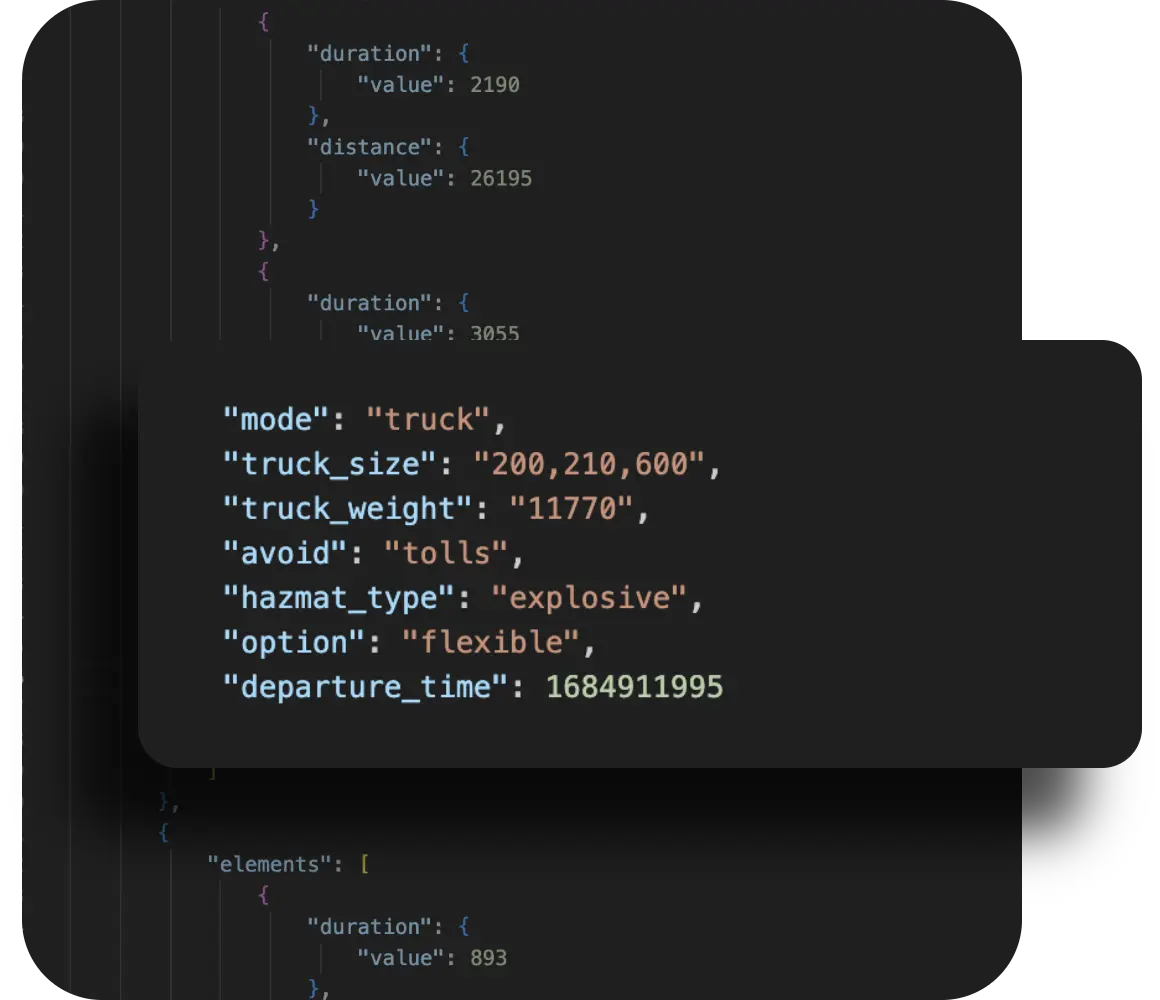
Additionally, the Directions Flexible API factors in real-time traffic conditions and offers route customization options. Companies can choose between the fastest or shortest routes depending on the delivery priorities and receive segment-wise speed limits to optimize their driving strategy.
Congestion can lead to unexpected delays, especially if it isn’t accounted for in the route planning process. NextBillion.ai’s Directions API integrates real-time traffic data, enabling logistics companies to calculate traffic-aware ETAs and avoid congested routes. This reduces the risk of on-road surprises and helps delivery vehicles bypass traffic bottlenecks.
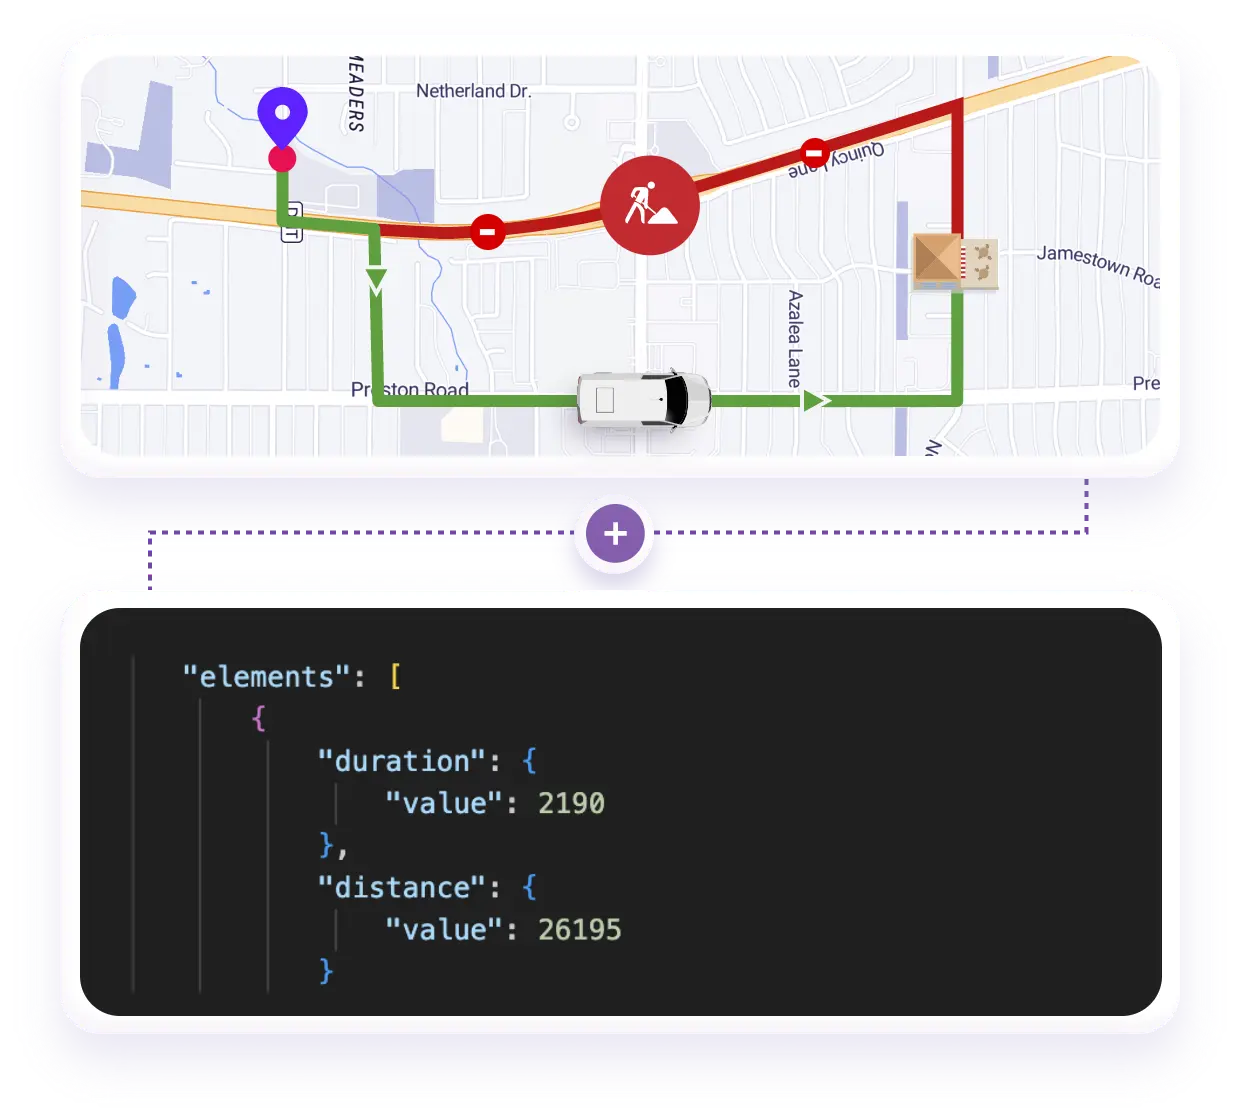
By using this API, logistic operations can proactively manage traffic disruptions, ensuring that drivers take the most efficient routes based on current traffic conditions.
For logistics companies operating in cities with complex traffic patterns, route restrictions can significantly affect travel times. The Directions Flexible API allows companies to apply custom route restrictions to their maps, such as avoiding tolls, ferries, or u-turns. This helps in generating realistic ETAs and distances, providing more accurate delivery timelines.
For example, if a company knows that certain roads are closed or heavily congested during specific hours, they can use these restrictions to avoid those routes automatically. This flexibility allows logistics managers to plan routes that minimize disruptions and ensure smoother deliveries.
For logistics companies managing multiple deliveries across a large network, the Asynchronous Distance Matrix API is a powerful tool. This API computes distances and ETAs between a large set of origins and destinations, making it perfect for one-to-many or many-to-many delivery scenarios. The asynchronous nature of the API allows users to submit large sets of coordinates and retrieve results later, enabling logistics managers to process vast amounts of data without delay.
This API is particularly useful for fleet managers who need to plan multiple deliveries simultaneously, ensuring that each route is optimized for speed and efficiency.
Here are some strategies that help to overcome traffic congestion and speed up the logistics operation:
Moreover, NextBillion.ai’s Road Editor tool is a game changer in overcoming traffic congestion problems. It precisely reflects the road closure, restrictions, speed limits, and permits on the selected route. The fleet operators can utilize this tool to update the underlying road network data to reflect upcoming restrictions based on vehicle type, permissions, time of day, etc.