

Table of Contents
Seasoned product managers will agree - when you’re dealing with small numbers, there’s nothing as easy as calculating delivery times , it is simply a matter of plugging in the popular ‘you-know-which’ mapping API.
For on-demand rides and deliveries, ETAs are complicated.
Seasoned product managers will agree — when you’re dealing with small numbers, there’s nothing as easy as calculating delivery times — it is simply a matter of plugging in the popular ‘you-know-which‘ mapping API.
However, as time goes by and operations scale, most teams find out that consumer solutions are just not a good fit for an on-demand ride and delivery businesses. The nitty-gritty is simply too different to reconcile.
The bottom line is that one mapping solution doesn’t fit all — and since ETAs essentially drive your business, there’s too much at stake to leave this large a margin for error.
The Importance of Accurate ETAs for On-Demand Services

Simply put, ETAs are at the heart of your business. Not only do they drive the customer experience, but they’re also an integral pillar of operations. Critical business functions like allocation and pricing all heavily depend on having accurate and optimized timing.
Considering the vital role they play, one would think that calculating ETAs would pose less of a challenge. So why exactly are accurate and optimized ETAs so notoriously hard to get right? To the uninitiated (which unfortunately includes your customers at the moment), it’s as simple as calculating the time taken to travel from point A to point B — and there are plenty of technologies that can do this.
Of course, the reality is far different. When it comes to calculating ETAs for on-demand delivery or ride-hailing services, this reality involves more variables than just the distance or travel time between two locations.
Challenges while calculating the Estimated time of arrival (ETA)

- For deliveries, it’s rarely about ‘point to point‘ distance — your ETAs need to be calculated from ‘kitchen/counter to couch‘.
- This includes reaching the nearest parking to the location, walking to the kitchen/counter, getting the item prepared, walking back to the vehicle, reaching the delivery location, and arriving at the customer’s doorstep.
- Similarly for ride-hailing services, the total ETA should include the time it takes for a driver to get started, the time spent finding the exact pick-up/drop-off point and the waiting time
Other items closely related to ETAs you should take care of include:
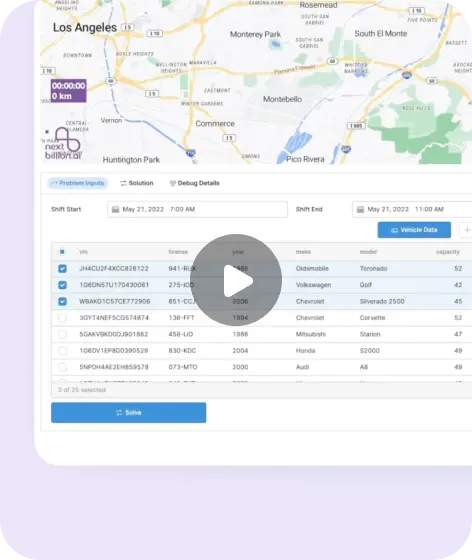
- Measuring accurate routes. Calculating accurate routes poses a challenge as your delivery agents/drivers might use other navigation apps or rely on their historical knowledge of the area to determine the route they take. Routing decisions are also influenced by other variables such as vehicle type (2-wheelers, 4-wheelers etc.) and local nuances. Thus, the actual route travelled might be quite different from the one predicted by your mapping solution, directly impacting the ETA.
- Tracking common drop-off points, pickup points, and POIs from public and private data
- Accounting for additional variables for high-throughput use-cases like shared rides.
So how do you work on a data-driven ETA approach that doesn’t take you weeks and months to cut down seconds in your delivery time? How do you shave minutes (and this is a big deal)off your ETA uncertainty?
Before we get to the good bits, let’s have a look at the bad.
Criterias that Influence ETA

Odds are that your current mapping solution is a global tech giant that has been at the forefront of mapping — but is built as a consumer solution. While their API is powerful, it also has some glaring issues that become acutely challenging at larger volumes.
Here are some factors that it doesn’t account for:
- Your unique use case — how do you incorporate factors unique to your business such as high start times, parking locations, walking times, and ‘last yard’ routing inside areas like apartment complexes, airports, and malls.
- Your vehicle type — how do you optimize your routes to account for the type of vehicle being driven by your delivery agent/ driver; be it a 2-wheeler, car, PMD or any other
- Your scalability — how do you ensure system scalability at millions (and maybe billions) of API calls a day, managing factors like latency and throughput, while also keeping a close eye on API costs
- Your local contexts — how do you control nuances like managing non-serviceable areas, blocking of roads during events (like parades, religious events, local regulations), and applying other local traffic regulations independent of your mapping service provider
Clearly, an external provider with limited control — one that is built for commuters and not on-demand services — is not the best way to go. While an internal tool might offer far greater customizability — the learning curve and resource requirements (especially up-front) are enormous. The right ‘fit’ is clearly somewhere in between — a mapping solution provider that enables solutions built for your specific business needs.
Now that we’ve talked about the challenges, let’s look at the right framework to approach this ETA problem so you can arrive at the best decision for your business!
Calculating Estimated Time of Arrival

For us at NextBillion.ai, calculating the most accurate and optimized ETA is an obsession. In this pursuit of perfection, we’ve come to realize that while the traditional statistical metrics like RMSE and MAE have their place, they often fail to capture — and for most of your stakeholders, fail to communicate — the nuances of the ETA dilemma.
- For starters, these metrics aren’t sympathetic to a user’s needs which makes it difficult for a product manager to grasp why ETAs are important from a customer POV in the first place. For example, RMSE won’t differentiate between an order delivered 10 minutes early or 10 minutes late. However, the reality is the two cases are very distinct in the eyes of a customer.
- The next challenge arises in explaining the relevance of ETAs to other stakeholders. Upgrading your platform needs resources — but explaining to the CEO that you can improve your RSME from A to B if you invest additional time and money, it’s unlikely that they’ll understand the challenge. And it won’t be because you’re wrong, but because no one will understand what you’re saying!
Because of this, the best approach is to distill these metrics down to something that can show a direct impact on business and performance metrics.
At NextBillion.ai, a key metric we love to focus on instead is ‘promise kept’. It successfully overcomes the limitations of traditional statistical metrics by retaining valuable mathematical properties while also being easy to understand as well as communicate.
What exactly do we mean by ‘promise kept’?
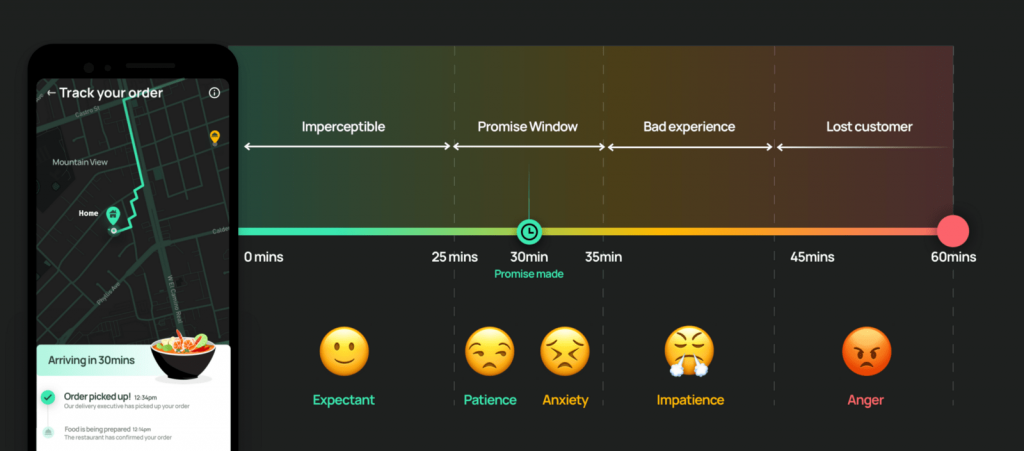
Simply put, whenever the time taken to provide the service (deliver an order/ complete a trip) to a customer roughly matches the ETA promised when the service request was made, the promise made has been kept. Here’s what this metric looks like:
Delivery time = Promised ETA ± Threshold time for the territory
The threshold time is generally a function of the prevailing socio-cultural practices of the geography — we’ve noticed that the ETA accuracy of the local public transport is a good measurement of this. This helps us understand consumer expectations when it comes to an acceptable waiting time.
For example, in Germany and Singapore, the public transportation arrival time is predicted down to the exact minute. Meaning that the arrival time looks something like 12:37PM instead of 12:35 PM or 12:40 PM. Thus, from a customer’s perspective, the acceptable waiting time would likely be less than 2 minutes.
In contrast, when it comes to India and Indonesia, the prevalent practice is to give broader time estimates. For example, people say that the train will arrive around 12:40 pm or that they will reach your house around 8 pm. Therefore, the acceptable waiting threshold of a customer may be more generous; say 5 or maybe even 10 minutes.Based on this, we get:
Promise kept metric *= (**Number of accurate orders*** /* *total orders of the day**) X 100*
*where delivery time was within the threshold
It’s easy to see why we love using the promise kept metric as a key indicator of ETA health — but this is only the tip of the proverbial iceberg. Now that you’ve uncovered the intricacies and metrics involved in calculating ETAs, the next step is to understand what you could be doing better.
Part 2 of our series delves into the approach you should take while evaluating the ETA strategy for your on-demand delivery or ride-hailing business and how you can use it to track the ROI of your mapping solution.
Ready to get started?
Request a DemoTable of Contents
Subscribe to our Newsletters
Get the best practices for route planning & optimization, delivered to your inbox.
Subscribe