

Table of Contents
Volume LTL Shipping Implementation
This technical notebook details the implementation of Volume Less-Than-Truckload (LTL) shipping using various NextBillion.ai products. The primary APIs utilized include the Route Optimization API, Flexible Directions API, and Web Maps SDK.
Problem Statement
The challenge at hand involves efficiently delivering bulk store orders from appliance manufacturers in Columbus to three distinct cities in the US: Los Angeles, Austin, and Detroit. The complexity arises from the requirement of using trucks equipped with liftgates for certain products during the final delivery, imposing a constraint on the delivery process. The objective is to optimize the transportation process, ensuring the efficient and timely delivery of products to the respective stores.
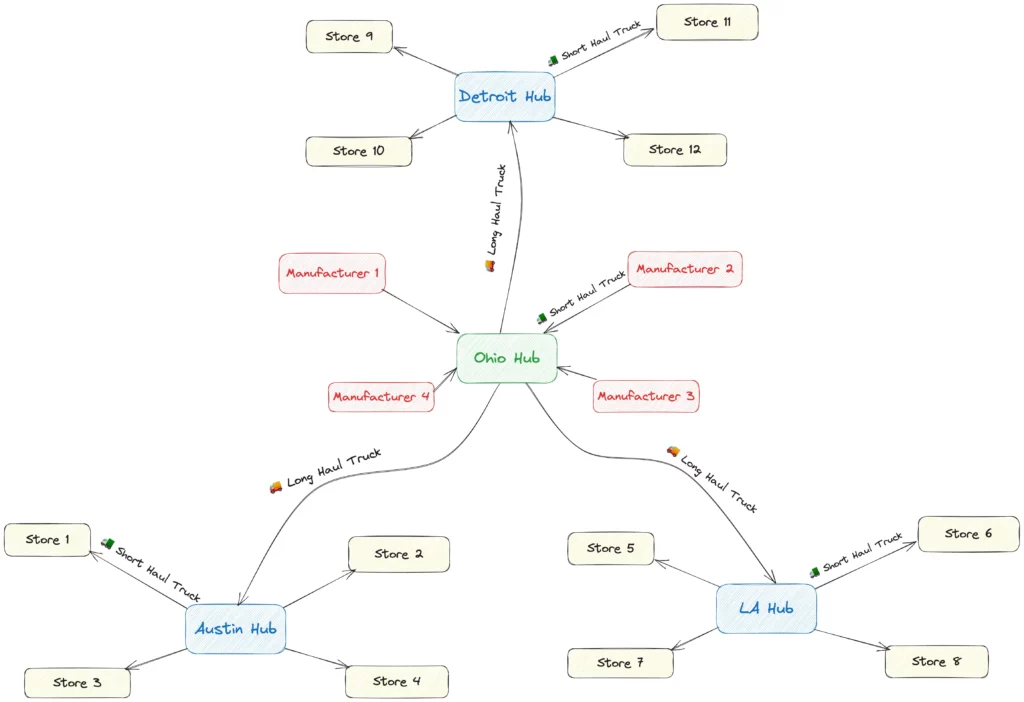
The following diagram illustrates this LTL Shipping problem.
Solution Approach
- Selection of Cities and Hubs
- Four cities, namely Columbus, Los Angeles, Detroit, and Austin, are arbitrarily chosen.
- Columbus is designated as the origin city.
- Each city is associated with a shipping hub, and multiple manufacturers are selected for each hub.
- Manufacturing and Product Specification
- Each manufacturer produces a single type of item (fridge, washing machine, AC, or dishwasher).
- Products like fridges and washing machines necessitate liftgate-equipped trucks for unloading.
- Store and Order Generation
- Each destination city has four electronics stores.
- Stores place orders ranging from 0 to 5 products from each manufacturer.
- Route Optimization
- Using the Flexible Directions API, optimal paths for trucks from manufacturers to the Columbus Shipping Hub are determined.
- Allocation of 10 long-haul trucks to the Columbus Shipping Hub.
- Utilization of the Route Optimization API to find optimal paths and item distributions for each long-haul truck (capacity: 30,000 pounds).
- Short-Haul Logistics
- Allocation of 10 short-haul trucks to each Destination Hub.
- Short-haul truck capacity is set at 5,000 pounds, with random assignment of liftgates.
- Calling the Route Optimization API once again to distribute items from Destination Hubs to short-haul trucks.
- Final Delivery to Stores
- Use of Route Optimization API for the last leg of the journey, distributing products from short-haul trucks to respective stores.
- Taking care of a specification that 20% of short-haul trucks lack liftgates, and orders involving fridges or washing machines require one.
Implementation Steps
In this technical notebook, we will guide you through the steps required to build, solve, and visualize a complex multi-vehicle routing problem tailored to this specific use case.
Step 1: Define Constraints
For simplicity, certain assumptions are made:
- Only the weight of items is considered, ignoring their volume.
- The Route Optimization API can handle multi-dimensional constraints beyond those accounted for in this solution. Refer to Route Optimization Tutorials.
Step 2: Enter NextBillion.ai API Key
To access NextBillion.ai APIs in this technical notebook, enter your assigned API key. Contact support@nextbillion.ai to obtain your API key.
Step 3: Define Capacity Parameters
In this step, we establish specific capacity parameters to guide the logistics of the transportation system. The following values are set:
- Number of Long-Haul Trucks at Origin Hub:10
- Number of Short-Haul Trucks at Each Destination Hub: 10
- Long-Haul Truck Capacity: 30,000 pounds
- Final Delivery Truck (Short-Haul) Capacity: 5,000 pounds
These parameters play a crucial role in optimizing the distribution and delivery process, ensuring efficient utilization of resources and meeting the requirements of the shipping operation.
Step 4: Data Preparation and Mapping
Manufacturers
The manufacturers’ information is captured in the manufacturersTable array, providing a clear representation of key details. The data mapping is performed using the following structure.
manufacturersTable = MANUFACTURERS.map((manufacturer) => ({
  Id: manufacturer.id,
  Name: manufacturer.name,
  Item: PRODUCTS[manufacturer.item].name,
  City: CITIES[manufacturer.city].name,
  Coordinates: manufacturer.location.join(", "),
  "Postal Code": `${manufacturer.postalCode}`
}))
The following table represents manufacturer information.
ID | Name | Item | City | Coordinates | Postal Code |
0 | Best AC Company | AC | Columbus | -82.92288, 40.09587 | 43081 |
1 | Cool Fridges | Fridge | Columbus | -82.84959, 39.89277 | 43110 |
2 | Dishy Dish Washers Corp | Dishwasher | Columbus | -83.1163, 39.90666 | 43123 |
3 | Wishing Machines | Washing Machine | Columbus | -83.34013, 40.1381 | 43064 |
Orders
The ordersTable is an Array of 12 objects representing store orders.
ordersTable = Array(12) [
 0: Object {Store: "Smitham Inc", City: "Austin", ac: 0, fridge: 4, dish_washer: 4, washing_machine: 4}
 1: Object {Store: "Goyette, Stroman and Schiller", City: "Austin", ac: 3, fridge: 2, dish_washer: 2, washing_machine: 4}
 2: Object {Store: "Feest and Hermann", City: "Austin", ac: 5, fridge: 3, dish_washer: 5, washing_machine: 1}
 3: Object {Store: "Bashirian and Sons", City: "Austin", ac: 5, fridge: 4, dish_washer: 4, washing_machine: 3}
 4: Object {Store: "Jones - Durgan", City: "Los Angeles", ac: 3, fridge: 0, dish_washer: 4, washing_machine: 0}
 5: Object {Store: "Larson - Schowalter", City: "Los Angeles", ac: 0, fridge: 1, dish_washer: 0, washing_machine: 0}
 6: Object {Store: "Baumbach, Gutkowski and Schinner", City: "Los Angeles", ac: 4, fridge: 4, dish_washer: 4, washing_machine: 3}
 7: Object {Store: "Stark Inc", City: "Los Angeles", ac: 0, fridge: 3, dish_washer: 2, washing_machine: 2}
 8: Object {Store: "Casper, Bashirian and Bogisich", City: "Detroit", ac: 4, fridge: 5, dish_washer: 2, washing_machine: 3}
 9: Object {Store: "Keeling Inc", City: "Detroit", ac: 3, fridge: 3, dish_washer: 0, washing_machine: 0}
 10: Object {Store: "Mueller - Bosco", City: "Detroit", ac: 0, fridge: 4, dish_washer: 3, washing_machine: 2}
 11: Object {Store: "Rice - MacGyver", City: "Detroit", ac: 4, fridge: 3, dish_washer: 3, washing_machine: 4}
]
The following table represents order information in a structured format.
Id | Store | AC | Fridge | Dish Washers | Washing Machine | City |
0 | Smitham Inc | 0 | 4 | 4 | 4 | Austin |
1 | Goyette, Stroman and Schiller | 3 | 2 | 2 | 4 | Austin |
2 | Feest and Hermann | 5 | 3 | 5 | 1 | Austin |
3 | Bashirian and Sons | 5 | 4 | 4 | 3 | Austin |
4 | Jones – Durgan | 3 | 0 | 4 | 0 | Los Angeles |
5 | Larson – Schowalter | 0 | 1 | 0 | 0 | Los Angeles |
6 | Baumbach, Gutkowski and Schinner | 4 | 4 | 4 | 3 | Los Angeles |
7 | Stark Inc | 0 | 3 | 2 | 2 | Los Angeles |
8 | Casper, Bashirian and Bogisich | 4 | 5 | 2 | 3 | Detroit |
9 | Keeling Inc | 3 | 3 | 0 | 0 | Detroit |
10 | Mueller – Bosco | 0 | 4 | 3 | 2 | Detroit |
11 | Rice – MacGyver | 4 | 3 | 3 | 4 | Detroit |
Step 5: Generating Routes from Manufacturers to Origin Hub
In this step, we call NextBillin.ai’s Directions API to generate transportation routes from each manufacturer’s location to the origin hub in Columbus. The following code snippet demonstrates this asynchronous calculation using JavaScript’s Promise.all functionality:
companiesToOriginHubDirections = Promise.all(
  MANUFACTURERS.map((manufacturer) =>
    getDirection(manufacturer.location, ORIGIN_HUB.location)
  )
);
Process Explanation
1. Mapping Manufacturers
- The `MANUFACTURERS` array is iterated using the map function, addressing each manufacturer’s data.
2. Asynchronous Direction Calculation
- For each manufacturer, the `getDirection` function is invoked. This function is presumed to be a Promise-based operation that calculates the optimal route between two geographical locations.
3. Promise.all Integration
- The `Promise.all` function is employed to handle the array of promises generated in the mapping process.
- It concurrently executes all the promises, ensuring efficient parallelization of the direction calculations.
4. companiesToOriginHubDirections Promise
- The result is encapsulated in the `companiesToOriginHubDirections` promise.
- This promise will resolve to an array containing the calculated directions for each manufacturer’s route to the origin hub.
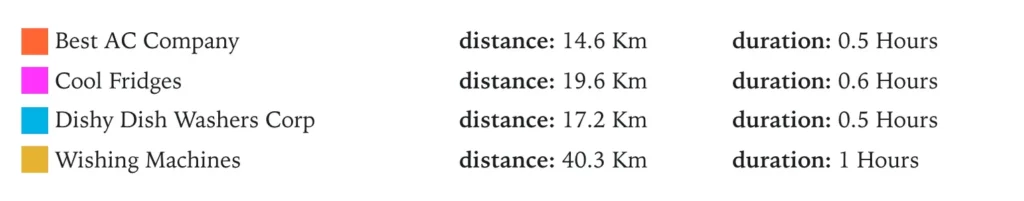
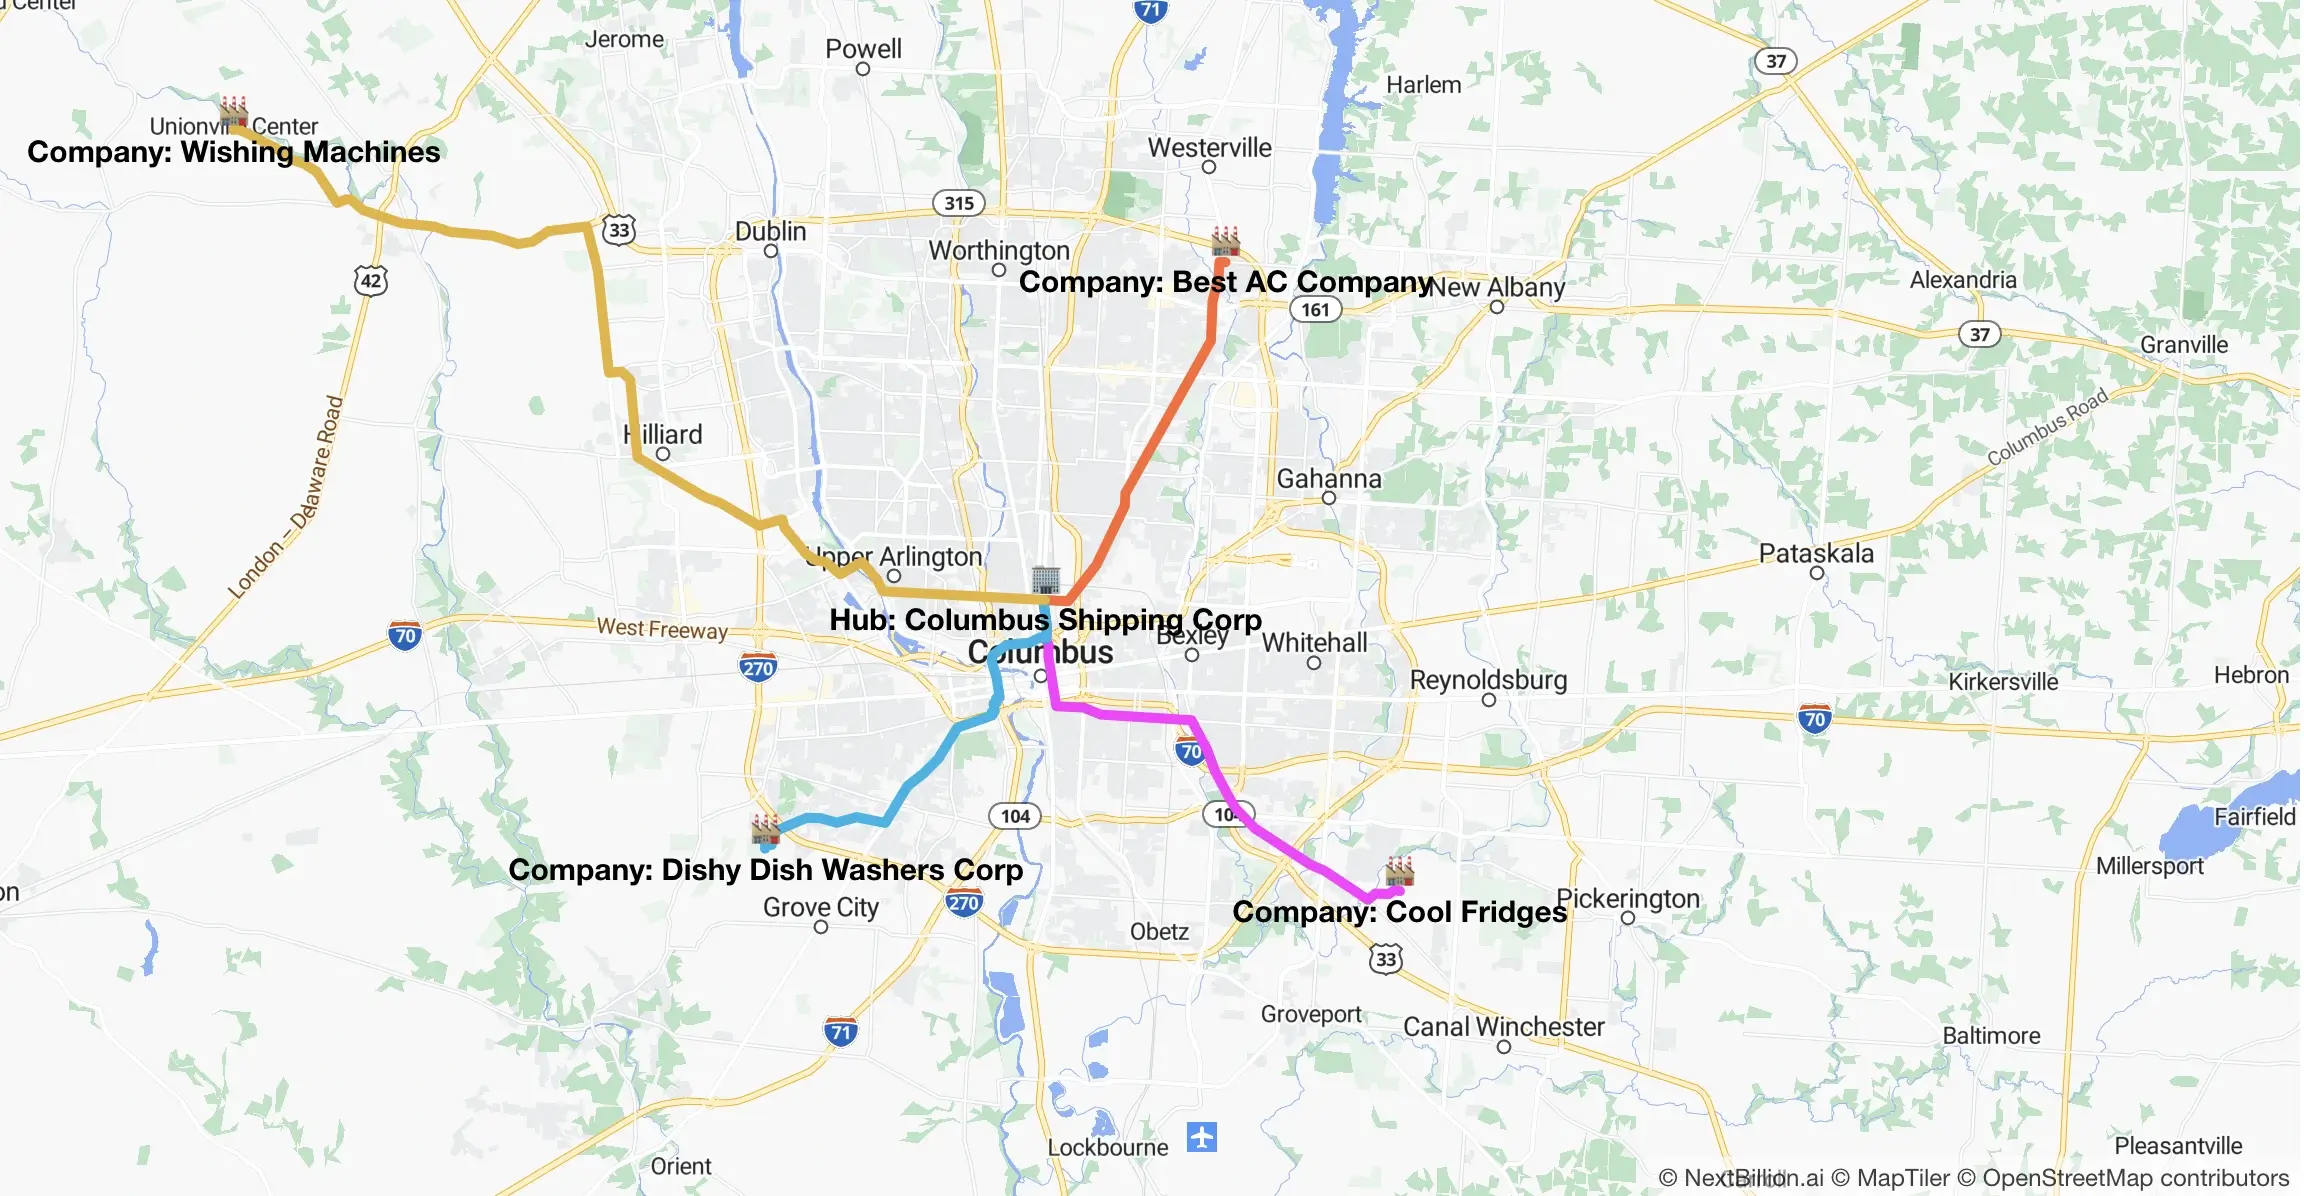
The following image summarizes the transportation routes from each manufacturer to the origin hub.
To visualize the result on a map, use the following code snippet to render a map using NextBillin.ai’s Web Maps SDK.
const nbmap = new nextbillion.maps.Map({
    container: document.getElementById("map-2"),
    center: {
      lat: CITIES.columbus.centroid[1],
      lng: CITIES.columbus.centroid[0]
    },
    zoom: 10,
    maxZoom: 15,
    minZoom: 0,
    style: "https://api.nextbillion.io/maps/streets/style.json",
    scrollZoom: true
  });

  nbmap.on("load", () => {
    drawHub(nbmap.map, ORIGIN_HUB);
    MANUFACTURERS.forEach((manufacturer) =>
      drawManufacturer(nbmap.map, manufacturer)
    );
    companiesToOriginHubDirections.forEach((directions, i) => {
      drawRoute(nbmap.map, `route-${i}`, directions[0], COLORS[i]);
    });
  });
}
The following image visualizes the routes assigned to each long-haul trucks from manufacturers to the central hub.
Step 6: Generating Routes from Origin Hub to Destination Hubs
In this step, we solve the multi-vehicle routing from the origin hub to various destination hubs, considering the specific capacities and constraints of each vehicle.
1. Truck Configuration at Origin Hub
The following array represents the details of 10 long-haul trucks with unique identifiers, names, VINs, and a common capacity of 30,000 pounds.
TRUCKS_AT_ORIGIN_HUB = Array(10) [
 0: Object {id: 0, name: "T680", vin: "Z730OM67K1GJ52751", capacity: 30000}
 1: Object {id: 1, name: "579", vin: "0S1DL9T5O5GK52021", capacity: 30000}
 2: Object {id: 2, name: "Cascadia", vin: "LPQJIV8H1RF898603", capacity: 30000}
 3: Object {id: 3, name: "VNL", vin: "D61S2MWH3MOG89872", capacity: 30000}
 4: Object {id: 4, name: "LT", vin: "GVKIU2MJXEG528568", capacity: 30000}
 5: Object {id: 5, name: "Anthem", vin: "39AM3EVHJZSP65749", capacity: 30000}
 6: Object {id: 6, name: "5700XE", vin: "NN74QJHRXGA984149", capacity: 30000}
 7: Object {id: 7, name: "T880", vin: "A4FMSP1QQAUI40255", capacity: 30000}
 8: Object {id: 8, name: "389", vin: "Y5R8PKDFT3VK51262", capacity: 30000}
 9: Object {id: 9, name: "Coronado", vin: "3NFZN8VJRFZ541838", capacity: 30000}
]
2. MVRP Input Configuration
Input data is configured using the following code snippet.
mvrpInputs = Object {
  depots: Array(1) [
    0: Object {id: 0, location_index: 0}
  ]
  locations: Object {
    id: 1
    location: "39.9869,-82.99876|30.32101,-97.73751|34.04014,-118.24741|42.38504,-83.07939"
  }
  jobs: Array(115) [
    // Details of 115 jobs representing delivery tasks, including location indices and pickup weights
  ]
  vehicles: Array(10) [
    // Details of 10 vehicles (trucks) with unique identifiers, capacity configurations, and maximum task limits
  ]
}
3. MVRP Input Generation Function.
The following function dynamically generates MVRP input based on hub locations, orders, and truck configurations.
mvrpInputs = {
  const locations = [];
  const pickupLocationIndex = 0;
  locations.push(transformPoint(ORIGIN_HUB.location));

  let locationIndex = 1;
  const jobs = [];
  const shipments = [];

  const hubLocationIndices = {};
  for (const hub of DESTINATION_HUBS) {
    hubLocationIndices[hub.city] = locationIndex++;
    locations.push(transformPoint(hub.location));
  }

  for (let orderId = 0; orderId < ORDERS.length; orderId++) {
    const order = ORDERS[orderId];
    const deliveryLocationIndex = hubLocationIndices[order.city];
    jobs.push({
      id: orderId,
      location_index: deliveryLocationIndex,
      // delivery: [PRODUCTS[order.itemId].weight],
      pickup: [PRODUCTS[order.itemId].weight]
    });
  }

  const vehicles = [];
  for (const truck of TRUCKS_AT_ORIGIN_HUB) {
    vehicles.push({
      id: truck.id,
      capacity: [truck.capacity],
      start_index: 0,
      max_tasks: 20
    });
  }

  return {
    depots: [{ id: 0, location_index: 0 }],
    locations: {
      id: 1,
      location: locations.join("|")
    },
    jobs,
    // shipments,
    vehicles
  };
}
4. Execute Route Optimization and Retrieve Results
After successfully executing the MVRP for the long-haul segment, the result is encapsulated in the following mvrpLongHaul object.
The `result` object gives a brief summary of the routes. The `routes` array represents individual routes for each long-haul truck.
mvrpLongHaul = Object {
 result: Object {
 code: 0
 summary: Object {
 cost: 12193937
 routes: 7
 unassigned: 0
 setup: 0
 service: 0
 duration: 394303
 waiting_time: 0
 priority: 0
 delivery: Array(1) [0]
 pickup: Array(1) [76800]
 distance: 12193937
}
 routes: Array(7) [
 0: Object {vehicle: 0, cost: 328277, steps: Array(22), service: 0, duration: 11703, waiting_time: 0, priority: 0, delivery: Array(1), pickup: Array(1), distance: 328277, geometry: "{|`sFfuqyN?E?E@_ADuCBkA@w@@q@BcBBcBBmB@qA@o@?G@o@D…AiFxAy@?A????????????????????????????????????????", long_vehicle_id: "0"}
 1: Object {vehicle: 1, cost: 328277, steps: Array(22), service: 0, duration: 11703, waiting_time: 0, priority: 0, delivery: Array(1), pickup: Array(1), distance: 328277, geometry: "{|`sFfuqyN?E?E@_ADuCBkA@w@@q@BcBBcBBmB@qA@o@?G@o@D…AiFxAy@?A????????????????????????????????????????", long_vehicle_id: "1"}
 2: Object {vehicle: 2, cost: 328277, steps: Array(5), service: 0, duration: 11703, waiting_time: 0, priority: 0, delivery: Array(1), pickup: Array(1), distance: 328277, geometry: "{|`sFfuqyN?E?E@_ADuCBkA@w@@q@BcBBcBBmB@qA@o@?G@o@D…_@Tg@ZqAp@MHYPMc@Me@y@sCQo@Mg@Uy@wAiFxAy@?A??????", long_vehicle_id: "2"}
 3: Object {vehicle: 3, cost: 1988558, steps: Array(18), service: 0, duration: 64366, waiting_time: 0, priority: 0, delivery: Array(1), pickup: Array(1), distance: 1988558, geometry: "{|`sFfuqyNAh@EzBAj@AlAAb@AZAx@?HA`@CfBAh@A|@F?L?d@…BKFORi@nCmHn@^t@^????????????????????????????????", long_vehicle_id: "3"}
 4: Object {vehicle: 4, cost: 3615995, steps: Array(22), service: 0, duration: 115231, waiting_time: 0, priority: 0, delivery: Array(1), pickup: Array(1), distance: 3615995, geometry: "{|`sFfuqyNAh@EzBAj@AlAAb@AZAx@?HA`@CfBAh@A|@F?L?d@…@UWiBmBKM????????????????????????????????????????", long_vehicle_id: "4"}
 5: Object {vehicle: 5, cost: 3615995, steps: Array(20), service: 0, duration: 115231, waiting_time: 0, priority: 0, delivery: Array(1), pickup: Array(1), distance: 3615995, geometry: "{|`sFfuqyNAh@EzBAj@AlAAb@AZAx@?HA`@CfBAh@A|@F?L?d@…@_@a@UWiBmBKM????????????????????????????????????", long_vehicle_id: "5"}
 6: Object {vehicle: 6, cost: 1988558, steps: Array(20), service: 0, duration: 64366, waiting_time: 0, priority: 0, delivery: Array(1), pickup: Array(1), distance: 1988558, geometry: "{|`sFfuqyNAh@EzBAj@AlAAb@AZAx@?HA`@CfBAh@A|@F?L?d@…Ri@nCmHn@^t@^????????????????????????????????????", long_vehicle_id: "6"}
]
}
 status: "Ok"
message: ""
}
The following function is used to execute MVRP with the generated inputs and retrieve the results.
mvrpLongHaul = {
  const result = await MVRP(mvrpInputs);
  return result;
}
The following table summarizes the route optimization results for long-haul trucks.
ID | Vehicle | Duration(in hours) | Distance (in KM) | Fridges | ACs | Dish Washers | Washing Machines | City |
0 | T680 | 3.3 | 328.3 | 7 | 4 | 3 | 6 | Detroit |
1 | 579 | 3.3 | 328.3 | 4 | 5 | 2 | 9 | Detroit |
2 | Cascadia | 3.3 | 328.3 | 0 | 0 | 3 | 0 | Detroit |
3 | VNL | 17.9 | 1,988.6 | 6 | 2 | 7 | 1 | Austin |
4 | LT | 32 | 3,616 | 6 | 3 | 5 | 6 | Los Angeles |
5 | Anthem | 32 | 3,616 | 4 | 8 | 4 | 2 | Los Angeles |
6 | 5700XE | 17.9 | 1,988.6 | 4 | 4 | 4 | 6 | Austin |
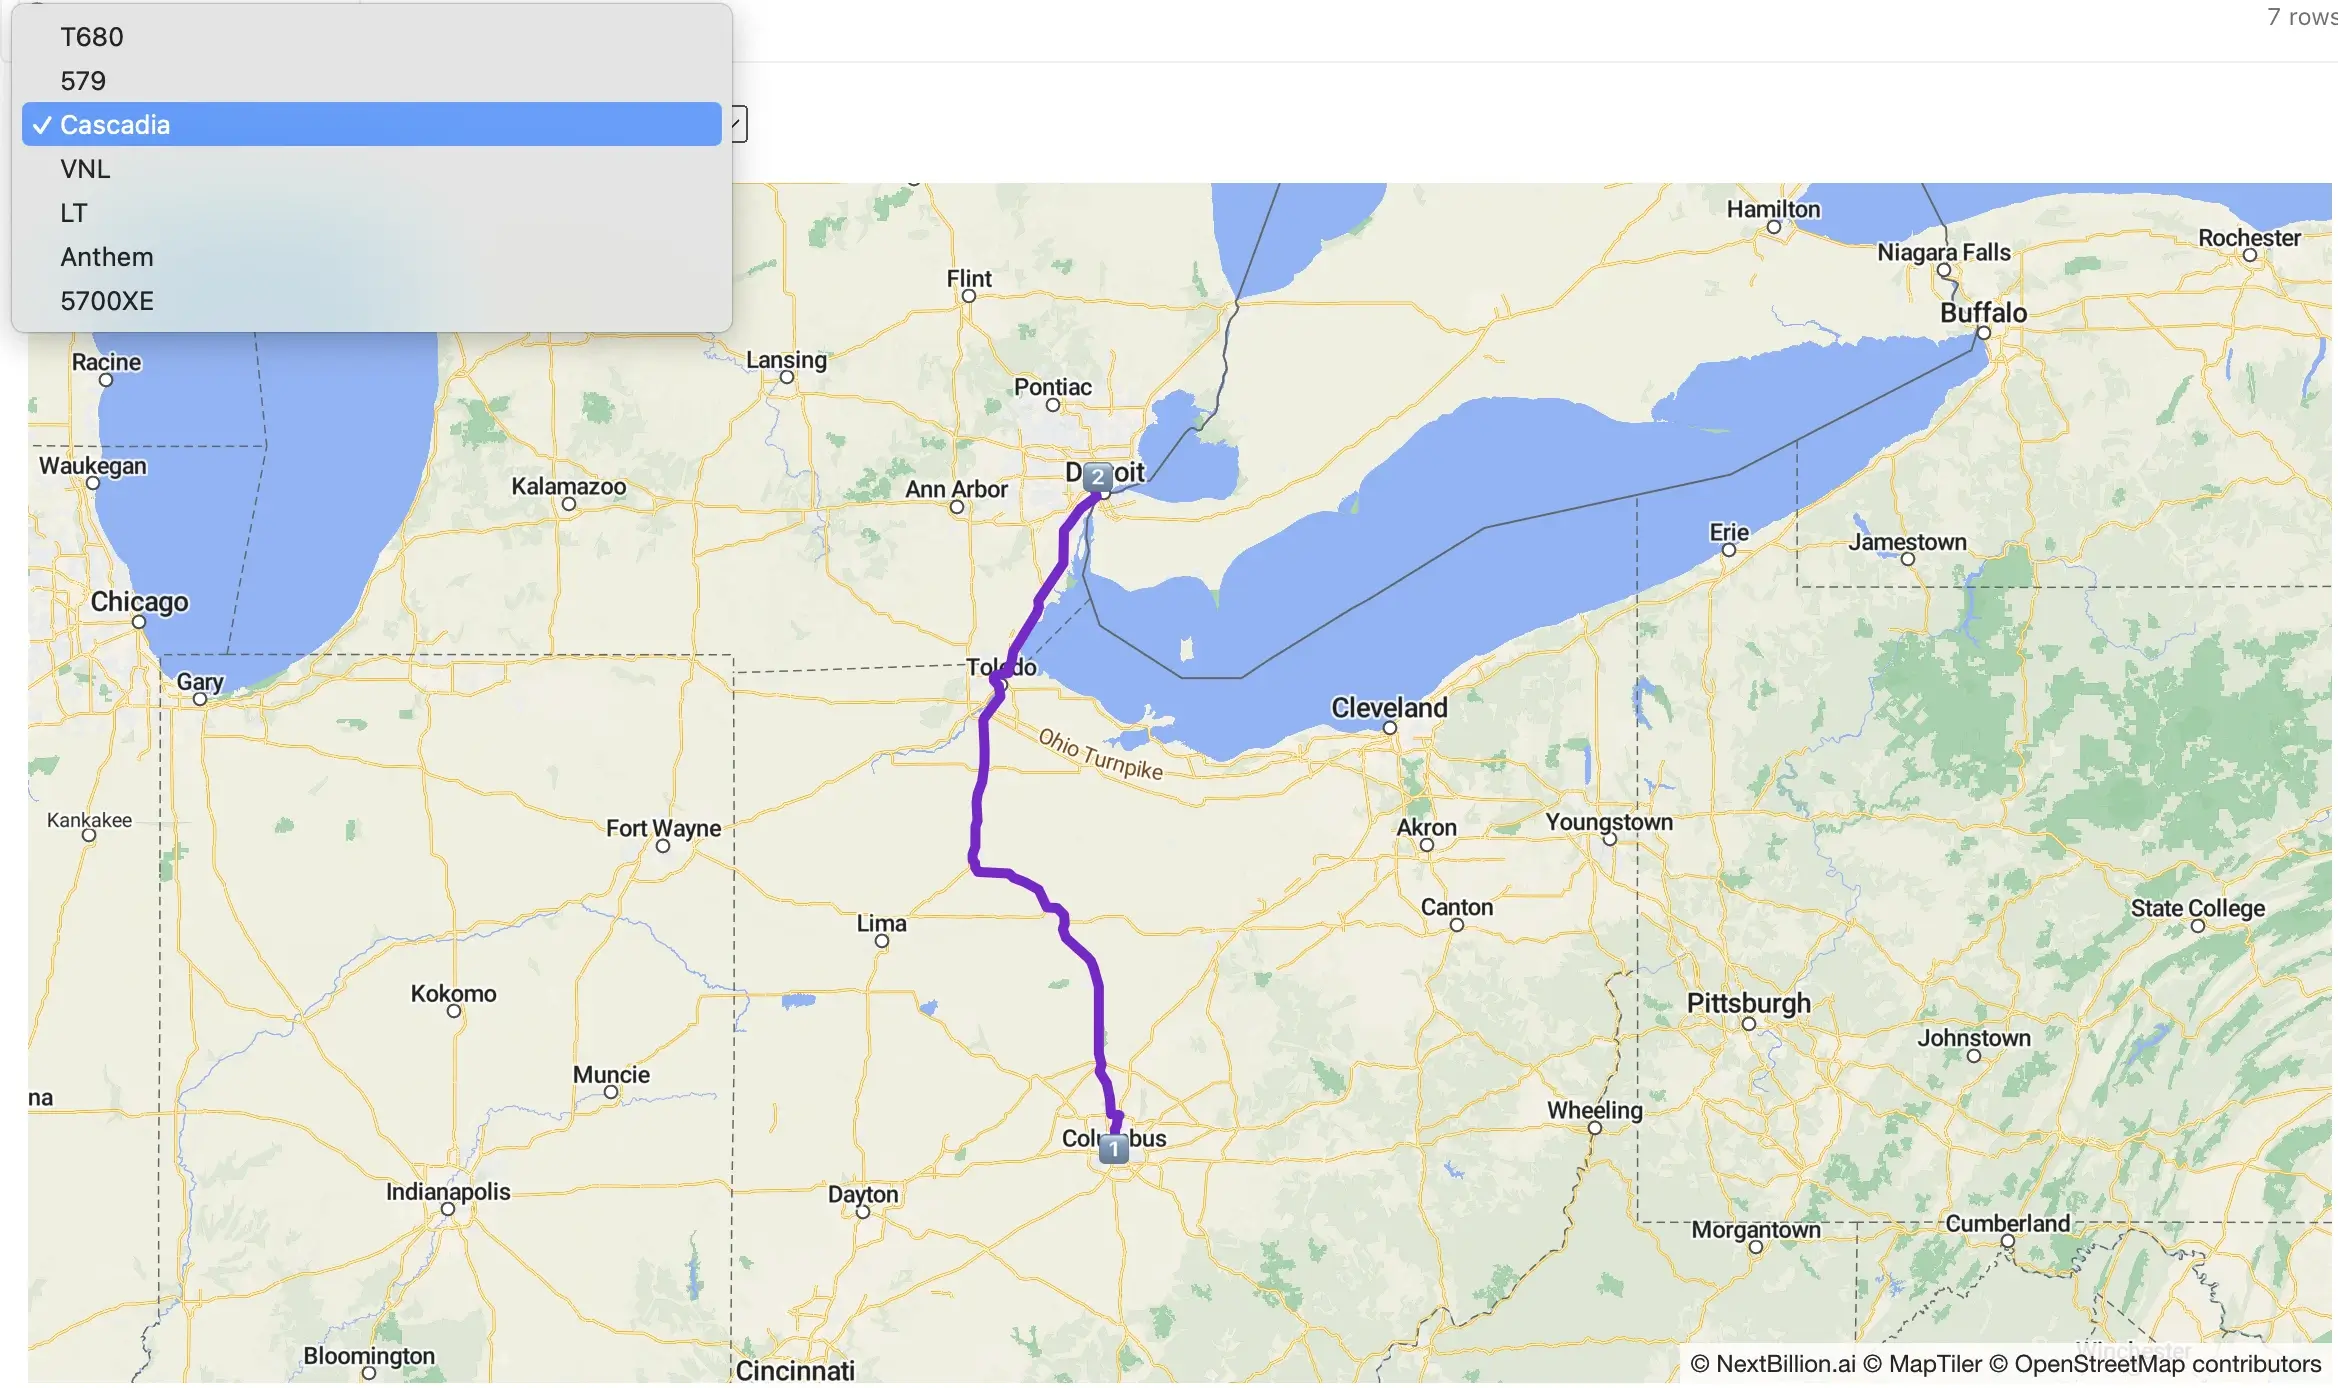
Select the Vehicle for which you want to visualize the route result. The subsequent image visualizes the routes for the truck ‘Cascadia’.
Step 7: Last-mile Delivery from Destination Hubs to Stores
This step focuses on the last-mile delivery of orders from the destination hubs to individual stores. The process involves optimizing routes for short-haul trucks based on specific city requirements. Let’s break down the key components:
1. Short-Haul Truck Allocation
The shortHaulTrucks object contains arrays of short-haul trucks for each destination city. The object has the following structure.
shortHaulTrucks = Object {
 austin: Array(10) [Object, Object, Object, Object, Object, Object, Object, Object, Object, Object]
 la: Array(10) [Object, Object, Object, Object, Object, Object, Object, Object, Object, Object]
 detroit: Array(10) [Object, Object, Object, Object, Object, Object, Object, Object, Object, Object]
}
2. MVRP Execution for Last-Mile Delivery
The following code asynchronously executes MVRP for the last-mile delivery in a specified city.
{
 mvrpFromDestinationHubs = {
  async function performMVRP(cityCode) {
    const orders = ORDERS.filter((order) => order.city === cityCode);
    const locations = [
      transformPoint(
        DESTINATION_HUBS.find((hub) => hub.city === cityCode).location
      )
    ];
    const hubLocationIndex = 0;

    let jobId = 0;
    const jobs = [];
    let locationIndex = 1;

    for (let i = 0; i < orders?.length; i++) {
      const order = orders[i];
      const store = STORES[order.storeId];
      jobs.push({
        id: jobId++,
        delivery: [PRODUCTS[order.itemId].weight],
        location_index: locationIndex++,
        skills: PRODUCTS[order.itemId].skills
      });
      locations.push(transformPoint(store.location));
    }

    let vehicles = [];
    for (const vehicle of shortHaulTrucks[cityCode]) {
      vehicles.push({
        id: vehicle.id,
        skills: _.random() < 0.2 ? [] : [0],
        start_index: hubLocationIndex,
        capacity: [inputs.shortHaulTruckCapacity],
        end_index: hubLocationIndex,
        description: vehicle.description
      });
    }
const result = await MVRP({
      locations: {
        id: 1,
        location: locations.join("|")
      },
      jobs,
      vehicles
    });
    return {
      cityCode,
      ...result
    };
  }

  return Promise.all(
    _.map(
      DESTINATION_HUBS.map((hub) => hub.city),
      performMVRP
    )
  );
}
}
Select the city for which you want to visualize the short-haul trucking routes.
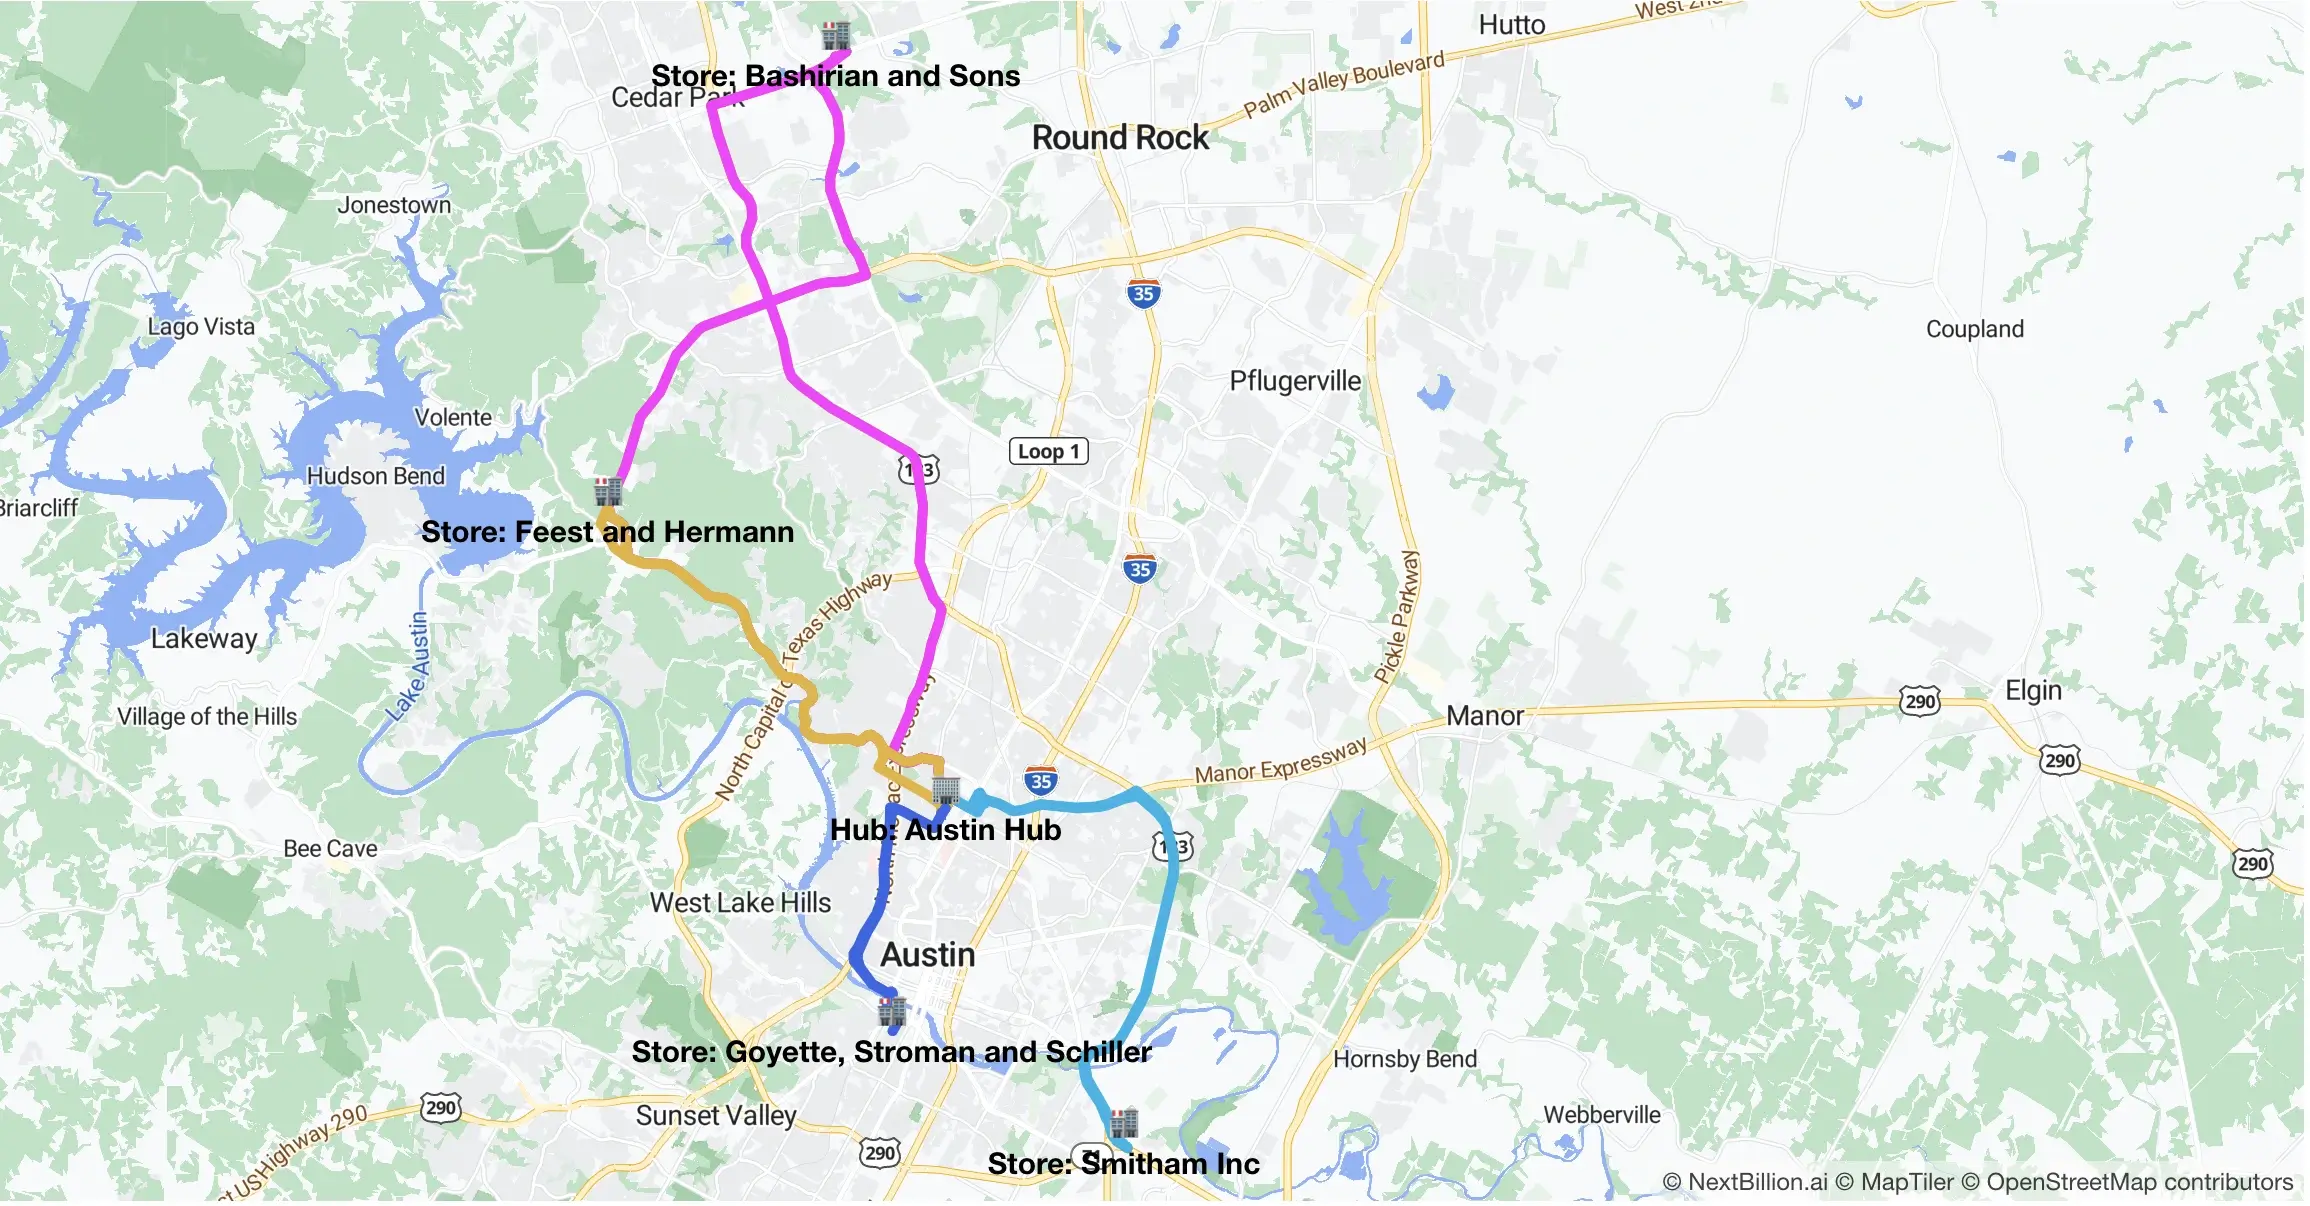
For this notebook, we select the city of Austin.
Post the route optimization process, all 34 orders received at the Austin hub were successfully delivered, employing an efficient distribution strategy across 5 out of the available 10 trucks.
The following table summarizes the optimized route result for the short-haul trucks in Austin.
ID | Name | Has Lift Gate | Orders |
0 | Truck 0 | Yes | 10 |
1 | Truck 1 | No | 5 |
2 | Truck 2 | Yes | 6 |
3 | Truck 3 | Yes | 5 |
4 | Truck 4 | No | 8 |
5 | Truck 5 | Yes | 0 |
6 | Truck 6 | Yes | 0 |
7 | Truck 7 | Yes | 0 |
8 | Truck 8 | No | 0 |
9 | Truck 9 | No | 0 |
Any of the trucks can be selected to visualize its individual route. The following image showcases the routes for all five trucks which are assigned orders.
This step finalizes the delivery process, optimizing routes for short-haul trucks to transport orders from destination hubs to individual stores efficiently. The result visualization provides insights into the distribution of orders among trucks and facilitates further analysis of the routing solution.