


Table of Contents
Creating Styled Clusters of Points on a Map
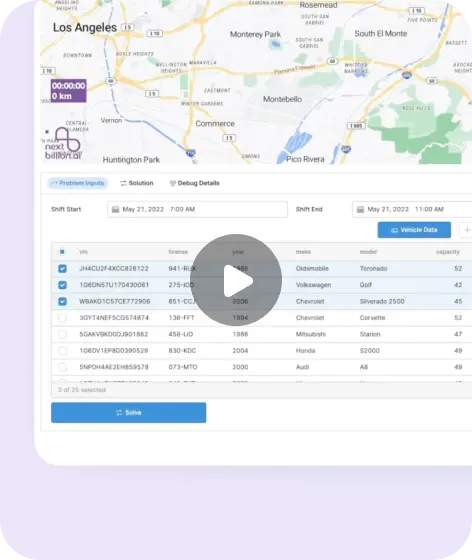
This technical notebook outlines the process of displaying a map with clustered points representing the number of vehicles, each indicated by a donut chart showing its capacity.
To begin, obtain your API key by contacting support@nextbillion.ai. Once acquired, set the API key using the following function.
nextbillion.setApiKey("your_api_key_here");
Additionally, include the NextBillion.ai SDK stylesheet in your HTML to ensure proper styling using the link provided below.
link href="https://maps-gl.nextbillion.io/maps/v2/api/css" rel="stylesheet"
Generating Random Points in Los Angeles
Using the NextBillion.ai SDK, create 1000 random points within the Los Angeles region. The `randomInputs` object contains information about the vehicle array, points array, vehicle GeoJSON, and the region.
const randomInputs = {
  vehicleArray: Array(10),
  pointsArray: Array(1000),
  vehGeoJson: Object,
  region: Object
};
The `vehicleLocations` object is a GeoJSON representation of the generated points.
const vehicleLocations = {
  type: "FeatureCollection",
  features: Array(1000)
};
Displaying Clustered Points with Donut Charts
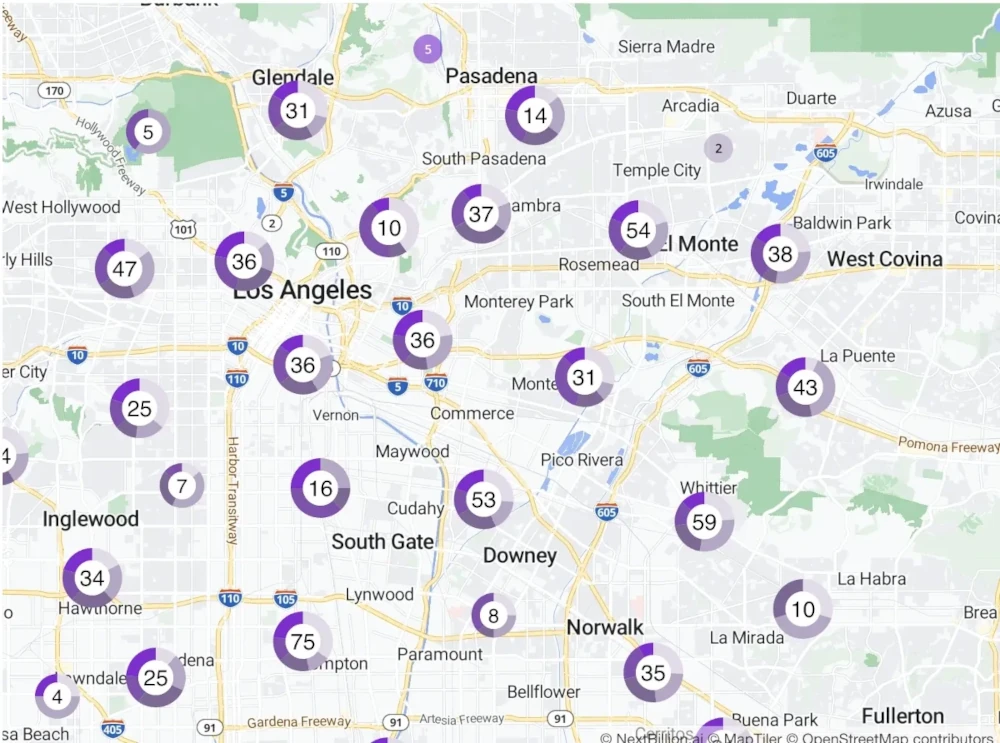
The NextBillion.ai SDK allows for the creation of styled clusters. When points are clustered, a donut chart is displayed, indicating the number of vehicles within the cluster. For unclustered points, the individual points will show the vehicle capacity.
This styling enhances the map’s visual representation, providing both an overview of clustered points and detailed information when zoomed in.
The following image visualizes styled clusters of points on a map.
By following this technical notebook, we have successfully implemented a map displaying styled clusters of points representing vehicle distribution. Utilizing the NextBillion.ai SDK enhances the visual presentation of geographical data, offering a balance between an overview of clusters and detailed information about individual points.