

Table of Contents
Visualizing Shared Mobility Bike Data with NB.ai Maps SDK and Deck.gl
The purpose of this technical notebook is to guide developers through the integration of NB.ai Maps SDK with Deck.gl to visualize shared mobility bike data. The NB.ai Maps SDK provides a seamless interface to incorporate the deck.gl content into interactive data visualizations. In this notebook, we’ll use data from CoGo, a bike-sharing service in Columbus, Ohio.
NB.ai Maps SDK
The NB.ai Maps SDK is a powerful tool that combines mapping functionality with various utilities to create engaging and informative visualizations. It is designed to streamline the integration of geographical data into applications, making it accessible for developers to create compelling location-based visualizations.
Deck.gl
Developed at Uber, deck.gl is an open-source library that enables WebGL-based visualizations of large datasets. It excels in handling geospatial data, making it an ideal companion for mapping applications. Integrating NB.ai Maps SDK and Deck.gl provides a robust platform for visualizing shared mobility bike data.
Getting Started
Set API Key
Before diving into the implementation, ensure you have an API key from NextBillion.ai. Contact support@nextbillion.ai to obtain your API key if you don’t have one.
The following code snippet initializes your API key.
// Setting the API key
nextbillion.setApiKey('your-api-key-here');
Data Overview
The sample data consists of information from CoGo, including the origin and destination stations for bike rides. The dataset is an array containing 342 objects, each representing a ride. These objects include details such as starting and ending stations.
Interactive Visualization
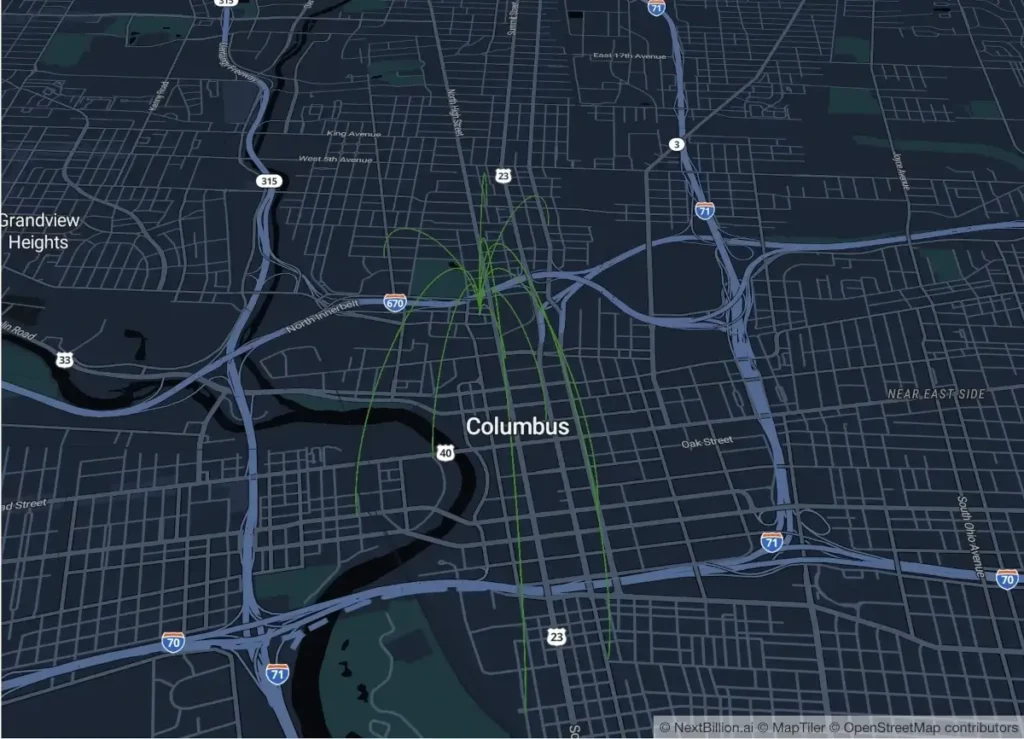
Selecting a Starting Station
The user can interactively choose a starting station for bike rides. For this example, we have selected `North Market`.
ArcLayer Visualization
To visualize the destination station for trips originating from the selected starting station, the Deck.gl ArcLayer is utilized. This layer displays arcs connecting the chosen starting station to various destination stations.
The following image visualizes the trips starting from `North Market` to various destinations.
This technical notebook has provided a brief overview of integrating the NB.ai Maps SDK with Deck.gl for visualizing shared mobility bike data. Developers can leverage this powerful combination to create engaging and informative geospatial visualizations within their applications.
Refer to Maps SDK Documentation and explore the full potential of the Maps SDK for your geographical data visualization needs.