

Table of Contents
Animating Trip Data with NB.ai Maps SDK and Deck.gl
The convergence of advanced geospatial data visualization and interactive mapping technologies has reached unprecedented heights. Deck.gl, which began as an open-source project at Uber, is designed to facilitate WebGL-based visualizations, particularly when dealing with large datasets.
In this technical notebook, we show how Deck.gl content can be integrated with NextBillion.ai’s Maps SDK to enable interactive data visualization. This collaboration will allow developers and data enthusiasts to create real-time, captivating animations that provide significant insight into geographic data movement and patterns.
Objective Statement
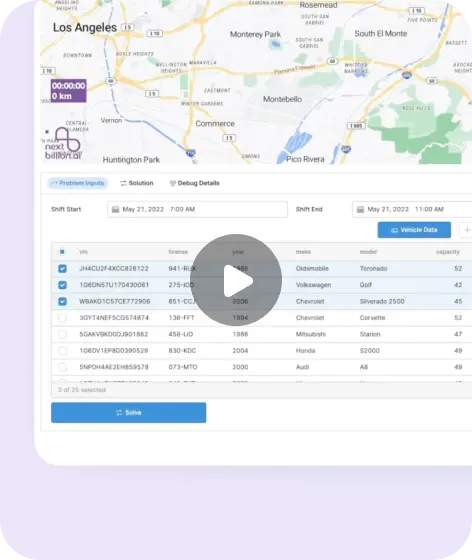
Our focus centers on the utilization of the well-known NYC Taxi Trip dataset. We create an animation of data points for each journey using the `deck.gl TripsLayer` module. When you click on the map, it advances the timeline and displays the path of each taxi. Right-clicking on the map halts the timeline. Line colors are determined by the ‘vendor’ data attribute, providing contextual information within the visualization.
JavaScript Module
The `nextbillion` object is a comprehensive library for mapping and geospatial services, offering a rich set of tools and features for developers. The library version is 2.3.0, and it provides functionality for various mapping-related tasks, including rendering maps, geolocation, navigation, and more.
The following code snippet represents a common structure for JavaScript libraries that aim to simplify and enhance the integration of mapping and geospatial services into web applications.
nextbillion = f {
maps: Object {
supported: ƒ(t)
setRTLTextPlugin: ƒ(…)
getRTLTextPluginStatus: ƒ()
Map: class
NavigationControl: class
GeolocateControl: class
AttributionControl: class
LogoControl: class
ScaleControl: class
FullscreenControl: class
TerrainControl: class
Popup: class
Marker: class
Style: class
LngLat: class
LngLatBounds: class
Point: ƒ(t, e)
MercatorCoordinate: class
Evented: class
AJAXError: class
config: Object {
MAX_PARALLEL_IMAGE_REQUESTS: 16
REGISTERED_PROTOCOLS: Object {}
}
CanvasSource: class
GeoJSONSource: class
ImageSource: class
RasterDEMTileSource: class
RasterTileSource: class
VectorTileSource: class
VideoSource: class
prewarm: ƒ()
clearPrewarmedResources: ƒ()
version: "2.3.0"
workerCount: 4
maxParallelImageRequests: 16
clearStorage: ƒ(…)
workerUrl: "blob:https://nbai.static.observableusercontent.com/00e5e19f-946e-46bc-a8c0-27a7b05c46dc"
addProtocol: ƒ(…)
removeProtocol: ƒ(…)
isSafari: ƒ(t)
getPerformanceMetrics: ƒ(…)
default: Object {
supported: ƒ(t)
setRTLTextPlugin: ƒ(…)
getRTLTextPluginStatus: ƒ()
Map: class
NavigationControl: class
GeolocateControl: class
AttributionControl: class
LogoControl: class
ScaleControl: class
FullscreenControl: class
TerrainControl: class
Popup: class
Marker: class
Style: class
LngLat: class
LngLatBounds: class
Point: ƒ(t, e)
MercatorCoordinate: class
Evented: class
AJAXError: class
config: Object {
MAX_PARALLEL_IMAGE_REQUESTS: 16
REGISTERED_PROTOCOLS: Object {}
}
CanvasSource: class
GeoJSONSource: class
ImageSource: class
RasterDEMTileSource: class
RasterTileSource: class
VectorTileSource: class
VideoSource: class
prewarm: ƒ()
clearPrewarmedResources: ƒ()
version: "2.3.0"
workerCount: 4
maxParallelImageRequests: 16
clearStorage: ƒ(…)
workerUrl: "blob:https://nbai.static.observableusercontent.com/00e5e19f-946e-46bc-a8c0-27a7b05c46dc"
addProtocol: ƒ(…)
removeProtocol: ƒ(…)
isSafari: ƒ(t)
getPerformanceMetrics: ƒ(…)
getPerformanceMetrics: ƒ(…)
}
NavigationService: class
OptimizationMvrpService: class
DirectionsService: class
DistanceMatrixService: class
SnapToRoadsService: class
}

utils: Object {
polyline: Object {
decode: ƒ(t, e)
encode: ƒ(t, e)
fromGeoJSON: ƒ(t, i)
toGeoJSON: ƒ(t, i)
  }
}

: f {
constructor: class
version: "2.3.5"
apiKey: ""
setApiKey: ƒ(…)
apiHost: "api.nextbillion.io"
setApiHost: ƒ(…)
EnableNBTransform: ƒ(…)
DisableNBTransform: ƒ(…)
}
}
The above JavaScript Module defines a `nextbillion` object. It contains various functions, classes, constants, and configuration properties that can be used in large applications to provide mapping and geospatial services.
Let’s break down the structure of this object. The key components of the `nextbillion` object are as follows:
1. `maps` Object: This property holds a collection of properties related to mapping and geospatial services. It includes classes and functions such as `Map`, `NavigationControl`, `GeolocateControl`, and more.
2. `config` Object: The `config` object defines configuration settings for the library. Notable properties include `MAX_PARALLEL_IMAGE_REQUESTS` (set to 16) and an empty `REGISTERED_PROTOCOLS` object.
3. `version` Property: This property stores the version of the library as a string, which is “2.3.0.”
4. `workerCount` Property: It represents the number of worker threads used by the library and is set to 4.
5. `maxParallelImageRequests` Property: This property sets a maximum limit of 16 for parallel image requests.
6. `workerUrl` Property: It contains a URL (presumably for web workers) where the library can load additional resources.
7. `addProtocol` and `removeProtocol` Functions: These functions handle adding and removing communication protocols.
8. `isSafari` Function: This function determines whether the user’s browser is Safari or not.
9. `getPerformanceMetrics` Function: This function may retrieve performance metrics related to the library’s operations.
10. `default` Object: This object has a similar structure to the `maps` and `config` objects, containing classes, functions, and constants.
11. Additional Services and Utilities: There are classes like `NavigationService`, `OptimizationMvrpService`, `DirectionsService`, `DistanceMatrixService`, and `SnapToRoadsService` that provide additional functionality related to navigation and routing.
12. `utils` Object: The `utils` object encompasses utility functions for handling polylines and GeoJSON data.
13. `<prototype>` Object: This object defines additional properties, classes, and functions. It specifies an API key (“Your_API_Key”), an API host (“api.nextbillion.io”), and functions like `setApiKey`, `setApiHost`, `EnableNBTransform`, and `DisableNBTransform`.
Trip Visualization
The provided code is a JavaScript object with a structured representation of NYC Taxi trip data mapping and data visualization project that involves Deck.gl and the NB.ai Maps SDK. It includes an array of trip data with various properties, as well as an object related to the deck.gl library.
The trip data is an array of 996 objects, each representing a trip with attributes like ‘vendor,’ ‘path,’ and ‘timestamps.’ The ‘deck’ object is a reference to the deck.gl library with various properties and methods. `deck.gl` library is imported using the `require` function.
trip_data = Array(996) [
  0: Object {vendor: 0, path: Array(18), timestamps: Array(18)}
  1: Object {vendor: 0, path: Array(14), timestamps: Array(14)}
  2: Object {vendor: 1, path: Array(151), timestamps: Array(151)}
  3: Object {vendor: 0, path: Array(55), timestamps: Array(55)}
  4: Object {vendor: 1, path: Array(39), timestamps: Array(39)}
  5: Object {vendor: 0, path: Array(195), timestamps: Array(195)}
  6: Object {vendor: 1, path: Array(41), timestamps: Array(41)}
  .
  .
  .
  .
  995: Object {vendor: 0, path: Array(5), timestamps: Array(5)}
]

import {secret2} from "@nbai/nextbillion-ai-dependencies"

deck = Object {
  VERSION: "8.8.23"
  version: "8.8.23"
  log: t {id: "deck", VERSION: "8.8.23", _startTs: 183.70000004768372, _deltaTs: 114827.10000002384, _storage: t, userData: Object, LOG_THROTTLE_TIMEOUT: 0, isEnabled: ƒ(), getLevel: ƒ(), getTotal: ƒ(), getDelta: ƒ(), getPriority: ƒ(), enable: ƒ(), setLevel: ƒ(), get: ƒ(), set: ƒ(), settings: ƒ(), assert: ƒ(), warn: ƒ(), error: ƒ(), …}
  _registerLoggers: ƒ(t)
  COORDINATE_SYSTEM: Object {DEFAULT: -1, LNGLAT: 1, METER_OFFSETS: 2, LNGLAT_OFFSETS: 3, CARTESIAN: 0}
  OPERATION: Object {DRAW: "draw", MASK: "mask"}
  UNIT: Object {common: 0, meters: 1, pixels: 2}
  LightingEffect: ƒ()
  AmbientLight: ƒ()
 DirectionalLight: ƒ()
  PointLight: ƒ()
  _CameraLight: ƒ()
  _SunLight: ƒ(t)
  PostProcessEffect: ƒ(e)
  _LayersPass: ƒ()
  Deck: ƒ(e)
  LayerManager: ƒ(e)
  AttributeManager: ƒ(e)
  Layer: ƒ()
  CompositeLayer: ƒ()
  DeckRenderer: ƒ(e)
 Viewport: ƒ()
  WebMercatorViewport: ƒ()
  _GlobeViewport: ƒ()
  OrbitViewport: ƒ(t)
  OrthographicViewport: ƒ(t)
  FirstPersonViewport: ƒ(t)
  picking: Object {inject: Object, name: "picking", vs: "uniform bool picking_uActive;\nuniform bool picking…\n    picking_vRGBcolor_Avalid.rgb = value;\n  }\n}\n", fs: "uniform bool picking_uActive;\nuniform vec3 picking…rn picking_filterPickingColor(highightColor);\n}\n\n", getUniforms: ƒ()}
  project: Object {name: "project", dependencies: Array(2), vs: "const int COORDINATE_SYSTEM_DEFAULT = -1;const int…c2 pixels) {\n  return pixels / project_uScale;\n}\n", getUniforms: ƒ()}
  project32: Object {name: "project32", dependencies: Array(1), vs: "\nvec4 project_position_to_clipspace(\n  vec3 positi…ition, position64Low, offset, commonPosition);\n}\n"}
  gouraudLighting: Object {name: "gouraud-lighting", dependencies: Array(1), vs: "\nuniform float lighting_uAmbient;\nuniform float li…alLight.color);\n    }\n  }\n  return lightColor;\n}\n", defines: Object, getUniforms: ƒ()}
  phongLighting: Object {name: "phong-lighting", dependencies: Array(1), fs: "\nuniform float lighting_uAmbient;\nuniform float li…alLight.color);\n    }\n  }\n  return lightColor;\n}\n", defines: Object, getUniforms: ƒ()}
  shadow: Object {name: "shadow", dependencies: Array(1), vs: "\nconst int max_lights = 2;\nuniform mat4 shadow_uVi…/ 2.0;\n      }\n    }\n  }\n  return gl_Position;\n}\n", fs: "\nconst int max_lights = 2;\nuniform bool shadow_uDr…\n      blendedAlpha\n    );\n  }\n  return color;\n}\n", inject: Object, getUniforms: ƒ()}
  View: ƒ(e)
  MapView: ƒ()
  FirstPersonView: ƒ()
  OrbitView: ƒ()
  OrthographicView: ƒ()
  _GlobeView: ƒ()
  Controller: ƒ(e)
  MapController: ƒ()
  _GlobeController: ƒ()
  FirstPersonController: ƒ()
  OrbitController: ƒ()
  OrthographicController: ƒ()
  LayerExtension: ƒ(e)
  TRANSITION_EVENTS: Object {BREAK: 1, SNAP_TO_END: 2, IGNORE: 3}
  TransitionInterpolator: ƒ(e)
  LinearInterpolator: ƒ()
  FlyToInterpolator: ƒ()
  assert: ƒ(t, e)
  createIterable: ƒ(t)
  fp64LowPart: ƒ(t)
  Tesselator: ƒ(e)
  _fillArray: ƒ(t)
  _flatten: ƒ(t)
 _count: ƒ(t)
  _memoize: ƒ(t)
  _mergeShaders: ƒ(t, e)
  _compareProps: ƒ(t)
  DeckGL: ƒ()
  ArcLayer: ƒ()
  BitmapLayer: ƒ()
  IconLayer: ƒ()
  LineLayer: ƒ()
  PointCloudLayer: ƒ()
  ScatterplotLayer: ƒ()
  ColumnLayer: ƒ()
  GridCellLayer: ƒ()
  PathLayer: ƒ()
  PolygonLayer: ƒ()
  GeoJsonLayer: ƒ()
  TextLayer: ƒ()
  SolidPolygonLayer: ƒ()
  _MultiIconLayer: ƒ()
  _TextBackgroundLayer: ƒ()
  ScreenGridLayer: ƒ()
 CPUGridLayer: ƒ()
  HexagonLayer: ƒ()
  ContourLayer: ƒ()
  GridLayer: ƒ()
  GPUGridLayer: ƒ()
  AGGREGATION_OPERATION: Object {SUM: 1, MEAN: 2, MIN: 3, MAX: 4}
  HeatmapLayer: ƒ()
  _GPUGridAggregator: ƒ(e)
  _CPUAggregator: ƒ(e)
  _AggregationLayer: ƒ()
  _BinSorter: ƒ()
  BrushingExtension: ƒ()
DataFilterExtension: ƒ()
  Fp64Extension: ƒ()
  PathStyleExtension: ƒ()
  FillStyleExtension: ƒ()
  ClipExtension: ƒ()
  MaskExtension: ƒ()
  project64: Object {name: "project64", dependencies: Array(2), vs: "\nconst vec2 WORLD_SCALE_FP64 = vec2(81.48732757568…, position64xyLow, offset, commonPosition\n  );\n}\n", getUniforms: ƒ(t)}
  GreatCircleLayer: ƒ()
  S2Layer: ƒ()
  QuadkeyLayer: ƒ()
  TileLayer: ƒ()
  TripsLayer: ƒ()
  H3ClusterLayer: ƒ()
  H3HexagonLayer: ƒ()
  Tile3DLayer: ƒ()
  TerrainLayer: ƒ()
  MVTLayer: ƒ()
  GeohashLayer: ƒ()
  _GeoCellLayer: ƒ()
  _getURLFromTemplate: ƒ(t, e)
  _Tileset2D: ƒ(e)
  _Tile2DHeader: ƒ(e)
  GoogleMapsOverlay: ƒ(e)
  SimpleMeshLayer: ƒ()
  ScenegraphLayer: ƒ()
  MapboxLayer: ƒ(e)
  MapboxOverlay: ƒ(e)
}


deck = require.alias({ h3: {}, s2Geometry: {} })("deck.gl@8.8.23/dist.min.js")"
The visual representation will resemble the following:

By harnessing the potential of NextBillion.ai’s Maps SDK and Deck.gl framework, users can gain valuable insights into the movements and patterns of geographic data. This innovative integration provides a promising path for data enthusiasts and developers to take their geospatial data visualization projects to the next level by providing a sophisticated and efficient solution for handling and presenting large datasets.